The Triple Play Report — 4/12/23
An earnings triple play is a stock that reports earnings and manages to 1) beat analyst EPS estimates, 2) beat analyst sales estimates, and 3) raise forward guidance. You can read more about “triple plays” at Investopedia.com where they’ve given Bespoke credit for popularizing the term. We like triple plays as an indication that a company’s business is firing on all cylinders, with above-expectations results and an improving outlook. A triple play is indicative of positive “fundamental momentum” instead of pure fundamentals, and there are always plenty of names with both high and low valuations on our quarterly list.
Bespoke’s Triple Play Report highlights companies that have recently reported earnings triple plays, and it features commentary from management on triple-play conference calls, company descriptions and analysis, and price charts. Bespoke’s Triple Play Report is available at the Bespoke Institutional level only. You can sign up for Bespoke Institutional now and receive a 14-day trial to read this week’s Triple Play Report, which features seven stocks. To sign up, choose either the monthly or annual checkout link below:
Bespoke Institutional – Monthly Payment Plan
10-Year 10-Baggers
Peter Lynch’s 1989 book One Up On Wall Street introduced investors to the word “ten bagger,” which represents an investment that appreciates by 10x (1,000%) its initial purchase price.
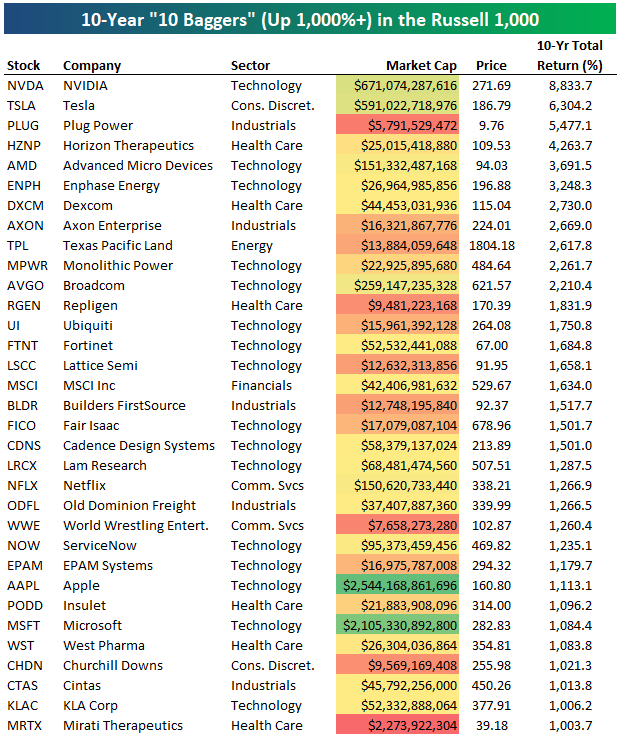
Today we wanted to highlight the stocks that have been “ten baggers” over the last ten years. In the Russell 1,000, 33 names are up more than 1,000% since April 12th, 2013. Over the same 10-year period, the S&P 500 tracking ETF (SPY) is up 211%. As shown below, NVIDIA (NVDA) is up the most with a gain of 8,833%, followed by Tesla (TSLA) at 6,304% and then Plug Power (PLUG) at 5,477%.
There are 16 Technology stocks on the list of 33 ten baggers, which is the most of any sector. Other Tech stocks on the list include AMD, Enphase Energy (ENPH), Broadcom (AVGO), Fortinet (FTNT), Lam Research (LRCX), and even the two largest stocks in the US – Apple (AAPL), and Microsoft (MSFT). Netflix (NFLX) is also another notable on the list with a gain of 1,266%.
Some other notables include Industrials stocks like Axon — the maker of Tasers and police body cameras, Industrials stocks like Builders FirstSource (BLDR) and Old Dominion Freight (ODFL), and Vince VcMahon’s World Wrestling Entertainment (WWE), which is set to be bought by Endeavor Group (EDR).
Stocks that are already up 1,000%+ over the last ten years seem unlikely to repeat that over the next ten years. The obvious next question is: which stocks will be ten baggers over the next ten years? As Peter Lynch instructed, you’ll have to do your research!
Have you tried Bespoke All Access yet?
Bespoke’s All Access research package is quick-hitting, actionable, and easily digestible. Bespoke’s unique data points and analysis help investors better visualize underlying market trends to ultimately make more informed investment decisions.
Our daily research consists of a pre-market note, a post-market note, and our Chart of the Day. These three daily reports are supplemented with additional research pieces covering ETFs and asset allocation trends, global macro analysis, earnings and conference call analysis, market breadth and internals, economic indicator databases, growth and dividend income stock baskets, and unique interactive trading tools.
Click here to sign up for a one-month trial to Bespoke All Access, or you can read even more about Bespoke All Access here.
Bespoke’s Morning Lineup – 4/12/23 – Here it Comes and There it Goes
See what’s driving market performance around the world in today’s Morning Lineup. Bespoke’s Morning Lineup is the best way to start your trading day. Read it now by starting a two-week trial to Bespoke Premium. CLICK HERE to learn more and start your trial.
“Simple can be harder than complex: You have to work hard to get your thinking clean to make it simple.” – Steve Jobs
Below is a snippet of content from today’s Morning Lineup for Bespoke Premium members. Start a two-week trial to Bespoke Premium now to access the full report.
Investors took an optimistic tone heading into the release of March CPI with futures marginally higher. Headline CPI came in at 0.1% m/m which was less than the 0.2% forecast. Core CPI increased by 0.4% which was right in line with forecasts. On a y/y basis, headline CPI was 5.0% versus estimates of 5.1% while core increased by 5.6% which was right in line with consensus forecasts. The immediate response in the futures market was higher equities and much lower yields as the 2-year drops back below 4%.
CPI reports have become increasingly important in the eyes of market commentators in the post-COVID environment. From an outsider’s perspective, you would think that these are the most important days of the month. Looking at the actual data, though, CPI reports may not necessarily be as impactful as you would originally think.
The chart below compares the S&P 500’s median daily percentage change on all market days versus CPI days for three different periods. First, for all days since 2000, the S&P 500’s median daily change is the same for all days versus CPI days (0.55%), so we can consider that the baseline. Since the start of 2020, when COVID first started showing up in the headlines, the S&P 500’s median daily percentage move on all days has been 0.74% versus 0.59% on CPI days. In other words, in the post-COVID world, the S&P 500 has been less volatile on CPI days versus all market days.
Where the stock market has become more volatile on CPI days is since November 2021 when Fed Chair Powell retired the term transitory. From then until now, the S&P 500’s median daily change has increased to 0.88% while on CPI days, it has risen to 0.95%. So, yes CPI reports have taken on an added significance, but they may not be as impactful as you would think from the headlines. CPI day or not, in the post-COVID world and even more so in the post ‘transitory’ world as the Fed aggressively hiked rates, the market has become more volatile on all trading days. This morning, the CPI report is the most important release of the year so far, but by this afternoon, it will have faded well into the rearview mirror.

Our Morning Lineup keeps readers on top of earnings data, economic news, global headlines, and market internals. We’re biased (of course!), but we think it’s the best and most helpful pre-market report in existence!
Start a two-week trial to Bespoke Premium to read today’s full Morning Lineup.
Industry Performance and CPI
Tomorrow’s release of March CPI is expected to show headline inflation cooling to 5.1% on a y/y basis from 6.0% in February. In the table below, we break down the average performance (in basis points) of each of the 24 industry groups in the S&P 500 on days of CPI releases since 2000 based on how the headline reading came in relative to expectations. There have been some notable shifts in reactions among groups to CPI reports in the pre and post-COVID (February 2020) periods. For example, in the pre-COVID period, the three best-performing industry groups on days when CPI was stronger than expected were Real Estate, Banks, and Semis. In the post-COVID period, though, these three industry groups have been among the market’s worst performers on CPI beats with all three averaging one-day declines of at least 69 bps compared to the S&P 500’s average decline of 62 bps. Interestingly, the disparity is a lot less apparent when we compare pre and post-COVID performance on days when CPI is weaker than expected.
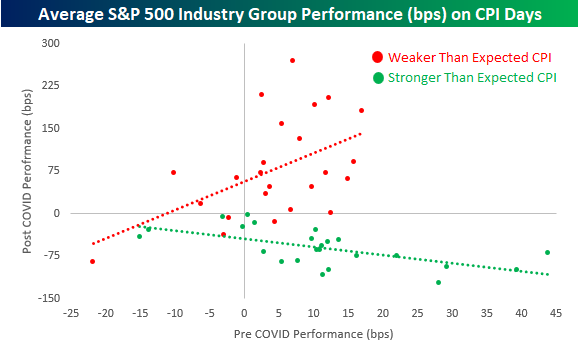
To further illustrate this shift and how it has been much more notable on days when the CPI is stronger than expected, the scatter chart below compares industry group performance on CPI days in the pre and post-COVID periods when the headline reading comes in better and worse than expected. Starting with weaker-than-expected CPI days (red dots and red trendline), the trendline is positively sloped as groups that tended to perform best on weaker-than-expected CPI days are generally still performing the best while the industry groups that lagged on weaker-than-expected CPI days still tend to lag in the post-COVID period. The performance dynamic on stronger-than-expected CPI days (green dots and trendline), however, is the complete opposite as the trendline is negatively sloped indicating that the best-performing groups pre-COVID have tended to be the weakest in the post-COVID period and vice versa.
Have you tried Bespoke All Access yet?
Bespoke’s All Access research package is quick-hitting, actionable, and easily digestible. Bespoke’s unique data points and analysis help investors better visualize underlying market trends to ultimately make more informed investment decisions.
Our daily research consists of a pre-market note, a post-market note, and our Chart of the Day. These three daily reports are supplemented with additional research pieces covering ETFs and asset allocation trends, global macro analysis, earnings and conference call analysis, market breadth and internals, economic indicator databases, growth and dividend income stock baskets, and unique interactive trading tools.
Click here to sign up for a one-month trial to Bespoke All Access, or you can read even more about Bespoke All Access here.
Inflation Concerns Continue to Ease
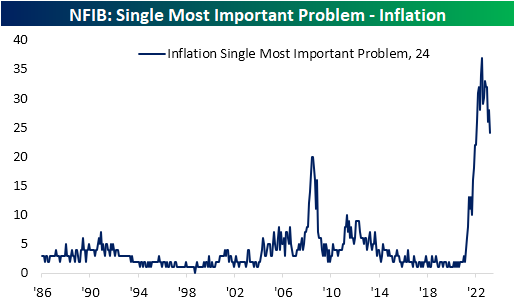
In an earlier post, we mentioned the record-low reading in the percentage of small businesses perceiving now as a good time to expand. As for what these firms perceive to be their most pressing issues, inflation continues to be the single most prevalent answer at 24%, albeit the gap has narrowed dramatically. Quality of labor is now only a single percentage point behind inflation at 23%, and when combined with cost of labor, the two issues account for over a third of small businesses’ biggest problems. From a historical standpoint, inflation, quality of labor, and cost of labor all remain elevated and account for a massive share (58%) of the most pressing issues facing small businesses.
The four percentage point drop month over month in the percentage of respondents reporting inflation as their biggest issue is the largest decline since January when it fell six percentage points. As a result, the category is only down to the lowest level since January 2022 which remains well outside the range of pre-pandemic readings. In other words, inflation has improved compared to last July when it was top of mind for 37% of small businesses, but it is still nowhere near a non-issue.
Picking up some of those losses has been government-related concerns. This series has historically held a political bias in which under Republican administrations, small businesses are less concerned with red tape and taxes and vice versa during Democratic administrations. With the surge in inflation concerns during President Biden’s tenure, this index has remained historically low but has begun to rise more recently as inflation has improved.
Another area to see a rise in firms reporting it as their biggest problem has been poor sales. While the reading is far from flying, it has begun trending higher now accounting for 5% of responses in March. That pairs with the index for actual reported sales changes which have remained firmly negative for nearly a year now. When poor sales turn into the biggest problem for a small business, you know times are really tough, which is why we’ll be watching this reading closely in the months ahead. For now, the reading is still extremely low, which is a good thing.
Have you tried Bespoke All Access yet?
Bespoke’s All Access research package is quick-hitting, actionable, and easily digestible. Bespoke’s unique data points and analysis help investors better visualize underlying market trends to ultimately make more informed investment decisions.
Our daily research consists of a pre-market note, a post-market note, and our Chart of the Day. These three daily reports are supplemented with additional research pieces covering ETFs and asset allocation trends, global macro analysis, earnings and conference call analysis, market breadth and internals, economic indicator databases, growth and dividend income stock baskets, and unique interactive trading tools.
Click here to sign up for a one-month trial to Bespoke All Access, or you can read even more about Bespoke All Access here.
Small Business Outlook Cratering
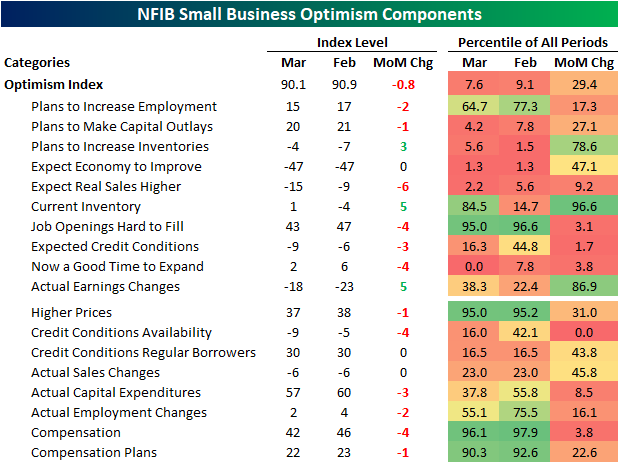
Small business optimism continued to decline in March with the headline index from the NFIB falling from 90.9 down to 90.1. That headline reading was actually better than the consensus forecast of 89.3, but it was still in the bottom decile of the indicator’s historical range dating back to 1986.
Looking across individual categories, breadth was weak in the report with only three indices moving higher month over month, three going unchanged, and all the others falling. As with the headline number, many categories are historically depressed in the bottom decile of readings, including some record lows.
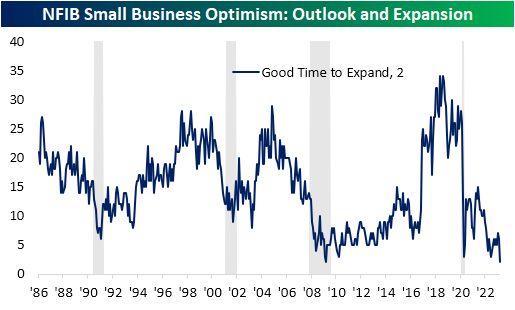
That record low was in the percentage of respondents reporting now as a good time to expand. Only 2% reported now as a good time to expand, down 4 points month over month. While the reading has been at the low end of its historical range for much of the past year, March’s reading matched the historical low from March 2009.
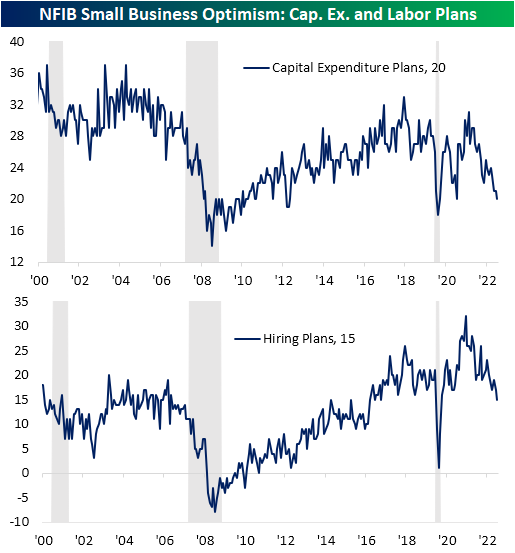
Given the small business outlook for the economy has soured, fewer firms are reporting plans to increase hiring or capital expenditures. In fact, the index for capex plans fell to 20, which alongside March 2021, is the lowest reading since the spring of 2020. Similarly, hiring plans are at new lows for the post-pandemic period.
One factor likely impacting business plans has been financial conditions. The most pronounced decline of any category last month was a record 4-point decline in the availability of loans. While the reading has been rolling over for some time, that drop leaves the index at the lowest level since December 2012.
Have you tried Bespoke All Access yet?
Bespoke’s All Access research package is quick-hitting, actionable, and easily digestible. Bespoke’s unique data points and analysis help investors better visualize underlying market trends to ultimately make more informed investment decisions.
Our daily research consists of a pre-market note, a post-market note, and our Chart of the Day. These three daily reports are supplemented with additional research pieces covering ETFs and asset allocation trends, global macro analysis, earnings and conference call analysis, market breadth and internals, economic indicator databases, growth and dividend income stock baskets, and unique interactive trading tools.
Click here to sign up for a one-month trial to Bespoke All Access, or you can read even more about Bespoke All Access here.
Bespoke’s Morning Lineup – 4/11/23 – Small Businesses Glum
See what’s driving market performance around the world in today’s Morning Lineup. Bespoke’s Morning Lineup is the best way to start your trading day. Read it now by starting a two-week trial to Bespoke Premium. CLICK HERE to learn more and start your trial.
“What are the odds that people will make smart decisions about money if they don’t need to make smart decisions—if they can get rich making dumb decisions?” – Michael Lewis
Below is a snippet of content from today’s Morning Lineup for Bespoke Premium members. Start a two-week trial to Bespoke Premium now to access the full report.
It’s looking like another quiet start to the trading day here in the US as equity futures are little changed and the yields on two and ten-year US Treasuries have moved less than a basis point. The only economic report on the calendar today was the NFIB’s index of small business sentiment, and while it was slightly better than expected, the headline index declined and remains below where it was at the depths of the COVID shutdowns. Within that report, the percentage of small businesses saying now is a good time to expand dropped to levels only seen at the depths of the Financial Crisis in March 2009 while the index for hiring plans dropped to its lowest level since May 2020. In other words, small business sentiment is not particularly optimistic. We’d also note that within the latest Commitment of Traders report, net short positions on the S&P 500 reached their highest level since 2007, so it’s not as though investors are positioned bullishly against the weaker macro backdrop.
In Europe, Retail Sales for February fell 0.8% on a m/m basis, but that was actually in line with expectations. Stocks on the continent are modestly higher after yesterday’s holiday
As recession concerns have grown in the wake of the SVB Financial and Signature Bank failures and the run of deposits from other smaller banks, investors have become increasingly convinced that the indicators which have been flashing recession warning signs for months now may in fact turn out to be accurate. If the economy was slipping into recession, one would expect to see those concerns manifesting in the performance of cyclical sectors. Specifically, Industrials would be one sector expected to underperform while defensive sectors like Utilities would outperform. Looking at the relative strength of the two sectors, however, the market’s message hasn’t exactly confirmed the headlines.
The chart below shows the ratio in closing prices between the S&P 500 Industrials sector ETF (XLI) versus the Utilities sector (XLU). When the line is rising, the Industrials sector is outperforming Utilities and vice versa. Over the last five years, there have been two distinct troughs in the chart. The first was in March 2020 while the next was last September. Back in late February, it looked as though the ratio was on the verge of hitting new five-year highs, but the bank failures and run on deposits stopped the relative outperformance of Industrials right in its tracks. It’s still too early to tell whether this will be a temporary pause or a new leg lower in the ratio, but with banks kicking off earnings season later this week, the tone of companies giving their results will shed a lot of light on that answer. At this point, if the market really was convinced of an impending recession, this ratio would likely be falling much faster.

Our Morning Lineup keeps readers on top of earnings data, economic news, global headlines, and market internals. We’re biased (of course!), but we think it’s the best and most helpful pre-market report in existence!
Start a two-week trial to Bespoke Premium to read today’s full Morning Lineup.
Full-Time Septuagenarian Workers Put in the Most Hours
We track US employment trends in our monthly Bespoke Consumer Pulse survey along with dozens of other interesting consumer and personal finance topics. Each month since 2014, we’ve asked our 1,500 survey participants (with balanced demographics according to the US census) whether they’re employed or not along with how many hours they typically work each week.
When it comes to the average hourly work week, we get the results below when we break down our survey response data by age. The two age bands of employed workers that work the least are the youngest (18 to 24) and oldest (75 or older). Those aged 45 to 54 work the most each week at 38.5 hours, while the 35 to 44 group works the second most at 37.6 hours.
Of course, the youngest workers and oldest workers could be working part-time, which would bring down the average work week for these two age bands. We get some interesting results when we look at average weekly hours for full-time employees only. As shown below, the oldest full-time employees average by far the most weekly hours at 43.0, while the three age bands between ages 45 and 74 all average right around 41 hours. The youngest full-time workers average the fewest weekly hours of any age band at 37.7.
Why would 75+ year-olds be working the longest hours of any age cohort when they’re supposed to be enjoying retirement? Is it work satisfaction? Work ethic? Economic reasons? This may be something we attempt to find out in future surveys!
If you would like to check out our full Bespoke Consumer Pulse report, here’s a link that tells you how to do that.
Have you tried Bespoke All Access yet?
Bespoke’s All Access research package is quick-hitting, actionable, and easily digestible. Bespoke’s unique data points and analysis help investors better visualize underlying market trends to ultimately make more informed investment decisions.
Our daily research consists of a pre-market note, a post-market note, and our Chart of the Day. These three daily reports are supplemented with additional research pieces covering ETFs and asset allocation trends, global macro analysis, earnings and conference call analysis, market breadth and internals, economic indicator databases, growth and dividend income stock baskets, and unique interactive trading tools.
Click here to sign up for a one-month trial to Bespoke All Access, or you can read even more about Bespoke All Access here.
Bespoke’s Morning Lineup – 4/10/23 – Cold Start
See what’s driving market performance around the world in today’s Morning Lineup. Bespoke’s Morning Lineup is the best way to start your trading day. Read it now by starting a two-week trial to Bespoke Premium. CLICK HERE to learn more and start your trial.
“I don’t think one should ever be satisfied with any objective that you’re trying to accomplish because perfection is never attained.” – Fred Ridley
Below is a snippet of content from today’s Morning Lineup for Bespoke Premium members. Start a two-week trial to Bespoke Premium now to access the full report.
With European markets closed for Easter and many Asian markets also still on holiday, it’s been a quiet pre-market session. Chinese stocks were open for trading, though, and they traded modestly lower. S&P 500 futures have been weakening into the open with the Nasdaq leading the way lower, as some of the tech sector’s outperformance this year gets unwound. Friday’s employment report has also raised the odds of a 25-bps hike at the May meeting to better than a two-in-three chance.
Enjoy the quiet while it lasts because earnings season kicks off at the end of this week when the major banks start to report on Friday with Blackrock (BLK), Citi (C), JPMorgan Chase (JPM), PNC (PNC), and Wells Fargo (WFC) all on the calendar. Outside of these banks, the only other notable reports this week will be Delta (DAL) on Thursday and UnitedHealth (UNH) on Friday.
It may be a dull start to the week for stocks, and from a bull’s perspective, dull is good. Historically, the week following Easter has been better than normal. Since 1945, the S&P 500’s median performance during Easter week has been a gain of 0.54% with positive returns just under 60% of the time. For all weeks in the post-WWII period, the S&P 500’s median weekly performance has been just over half of that at a gain of 0.29% with positive returns 56.6% of the time.
Breaking out performance further by how the market was performing YTD heading into the holiday when the S&P 500 was up on the year heading into Easter the median performance during Easter week was a gain of 0.67% with gains 61.7% of the time. That compares to a gain of just 0.20% in years when it was down YTD. Recall that last year, the S&P 500 was down 7.8% heading into Easter and declined 2.8% during Easter week.

Our Morning Lineup keeps readers on top of earnings data, economic news, global headlines, and market internals. We’re biased (of course!), but we think it’s the best and most helpful pre-market report in existence!
Start a two-week trial to Bespoke Premium to read today’s full Morning Lineup.
Bespoke Brunch Reads: 4/9/23
Welcome to Bespoke Brunch Reads — a linkfest of the favorite things we read over the past week. The links are mostly market related, but there are some other interesting subjects covered as well. We hope you enjoy the food for thought as a supplement to the research we provide you during the week.
While you’re here, join Bespoke Premium with a 30-day trial!
Renewables
Contingent Supply: Why Spodumene Reserves May Be the Key to a More Secure Lithium Supply Chain by Arnab Datta & Alex Turnbull (Employ America)
One possible approach to insuring price volatility in key EV inputs doesn’t get carried away is establishing strategic reserves of an important input. [Link]
A Football Field-Sized Boat Will Service US Offshore Wind Farms by Josh Saul (BNN Bloomberg)
In Louisiana, a shipyard is busy turning out the first wind farm service vessel designed to operate in US waters, part of a fledgling offshore industry in this country. [Link]
EVs
2025 Ram REV Just a Regular 1500 Truck With Electric Underpants by Alexander Stoklosa (MotorTrend)
Stellantis’ entry into the EV pickup market offers a massive 168kWh battery pack in its base model with a gigantic 229kWh pack in the longer-range version. That larger pack is a full 100 kWh larger than the F-150 Lightning, for a total size more than 4x that of a sedan like a Tesla Model 3. [Link]
Special Report: Tesla workers shared sensitive images recorded by customer cars by Steve Stecklow, Waylon Cunningham and Hyunjoo Jin (Reuters)
Tesla employees reportedly had access to and shared details from recordings from the company’s internal car cameras. [Link]
Taxes
Internal Revenue Service Inflation Reduction Act Strategic Operating Plan (IRS)
Last year the Inflation Reduction Act granted significant new resources to the IRS, with this report serving to update the Treasury Secretary on what it’s doing with those resources. [Link; 150 page PDF]
Sports
‘It’s about the damn money’ by Kent Babb (MSN/WaPo)
North Carolinian golfer and LIV Tour participant Harold William Varner III on why he’s joining the upstart Saudi golf tour; one part discussion of the golf business and one part biography for one of the most interesting characters in the game. [Link]
Babe Ruth bat sells for record $1.85M after ‘photographic corroboration’ by Dan Hajducky (ESPN)
A bat used by the Babe in 1921 has been photographically corroborated to establish he actually did swing the stick personally. [Link]
Interest Rates
Latest Fed Increase Came Down to the Wire. ‘That Was a Rough Weekend.’ by Nick Timiraos (WSJ)
FOMC voters only decided on their rate plans in the days immediately preceding the March meeting, a highly unusual outcome driven by the bank collapses of March. [Link; paywall]
The pain and SOFRing are almost over by Alexandra Scaggs (FTAlphaville)
After much sturm und drang, regulators have required that even though it will continue to be published, LIBOR will become synonymous with the reference rate that it’s being replaced by. [Link; soft paywall]
Real Estate
Moody’s: Multifamily Demand “Softened notably over the past few quarters” by Bill McBride (Calculated Risk)
Apartment landlords are reporting an uptick in vacancy rates and declining rents in just the latest sign that national rent tightness is over. [Link]
Read Bespoke’s most actionable market research by joining Bespoke Premium today! Get started here.
Have a great weekend!

