Hot April Core CPI Print Driven By Rents
Yesterday was a big day for inflation data as the BLS released April CPI (Consumer Price Index).
We all knew that spiking energy prices from the Iran War would impact headline CPI, but it was the core CPI reading, which strips out food and energy, that everyone was watching closely.
While economists expected core CPI to increase 0.3% month-over-month, it came in a tick higher than expected at 0.4% (4.6% annualized).
The jump in core CPI sent equity futures lower ahead of the open as interest rates rallied. Market pricing for Fed rate cuts took another hit, and the odds for rate hikes before year-end ticked higher.
When we looked underneath the surface of the core CPI print, the data wasn’t quite as scary.
The analysis below was included in our post-market macro note, The Closer, sent to Bespoke All Access subscribers yesterday. (Start a trial here to get it in your inbox going forward.)
While this was the second-largest monthly leap in core CPI since early 2023, rising 4.6% annualized, that acceleration was entirely due to the vagaries of the rent calculation.
Excluding rent, core CPI rose just 1.6% annualized and still looks similar to the pace it has trended at since 2023.
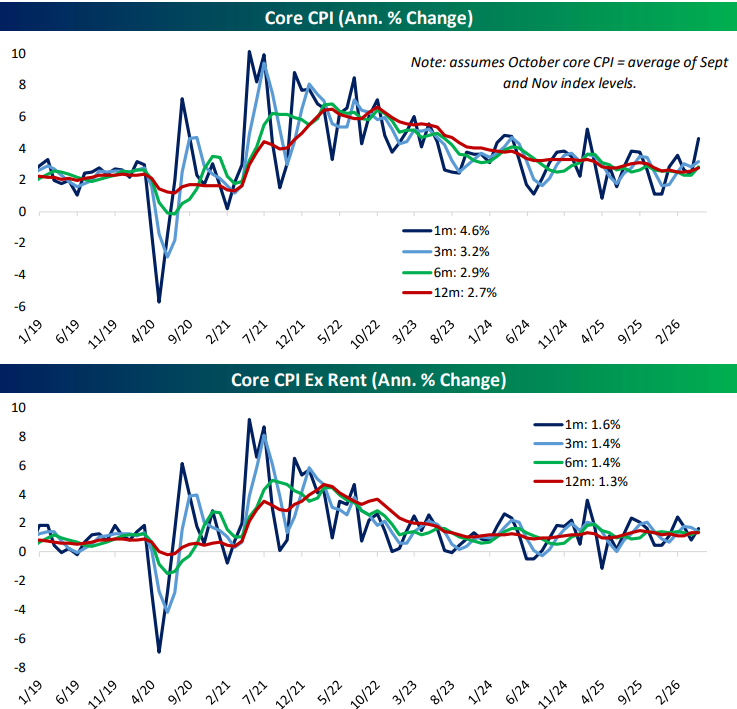
Because households are included in the rent survey on a six-month rotation, that index is still getting caught up from the government shutdown last year.
Households skipped in October were assumed to have no rent inflation for the last six months, which effectively jammed a year of rent increases for that subset into the April CPI report.
The result was a huge spike in rent in yesterday’s CPI release, which was a statistical mirage similar to the plunge observed in October. It should reverse in the coming months.
Want to read more in-depth market analysis from Bespoke? Join our Think BIG mailing list or Bespoke Premium by starting a trial today! Click below for details on how to sign up for Premium:

Bespoke’s Morning Lineup – 5/13/26 – Inflation Encore
See what’s driving market performance around the world in today’s Morning Lineup. Bespoke’s Morning Lineup is the best way to start your trading day. Read it now by starting a two-week trial to Bespoke Premium. CLICK HERE to learn more and start your trial.
“We should keep on going along the path of globalization. Globalization is good… when trade stops, war comes.” – Jack Ma

Below is a snippet of commentary from today’s Morning Lineup. Start a two-week trial to Bespoke Premium to view the full report.
Paul Hickey appeared on CNBC’s Squawk on the Street on Tuesday to discuss markets, semis, and inflation. To view the segment, click on the image below.
It’s hard to call yesterday’s decline (-0.16% in the S&P 500 and -0.71% in the Nasdaq) a dip, but investors have stepped in to buy it this morning as both the S&P 500 and Nasdaq are poised to erase yesterday’s losses at the open. Treasury yields are little changed, crude oil is fractionally lower, gold is higher, and Bitcoin is modestly lower but still above $80K.
The positive tone in US futures follows an up night in Asia as the Nikkei rallied 0.8% and South Korea jumped 2.6%. Chinese stocks are up 0.7% as Air Force One is touching down in Beijing as we type this.
In Europe, the tone is mixed with the STOXX 600 up 0.3% as Germany leads (+0.6%) and France and Spain decline fractionally. GDP in the Eurozone increased 0.1%, which was inline with expectations, while employment increased slightly more than expected, although French unemployment unexpectedly increased from 7.9% up to 8.1%.
The only economic report on the calendar this morning was April PPI, and boy, was it a clunker. Headline PPI surged 1.4% – not y/y but m/m while the core reading surged 1.0% versus estimates for an increase of just 0.3%. The headline index was only forecast to increase 0.5%. PPI tends to be more volatile than CPI, but these numbers are hot, hot, hot. As you would expect, the immediate response in the futures market was for yields to spike higher while equities erased half of their pre-release gains.
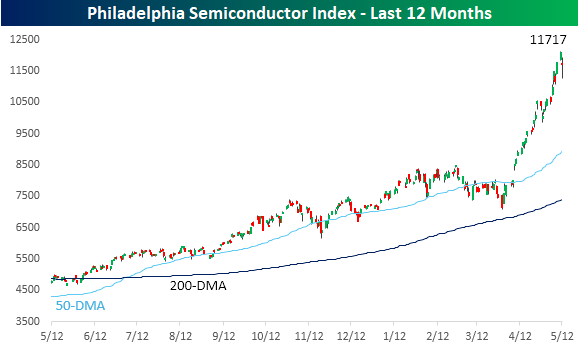
It was bound to happen at some point. After seemingly going up every day lately, the Philadelphia Semiconductor Index (SOX) declined just over 3% yesterday after falling as much as 6.7% on an intraday basis. Even for semis, swings and declines of that magnitude are notable, but looking at the chart, you can barely see them. Even after that drop, the SOX is still 31% above its 50-day moving average.
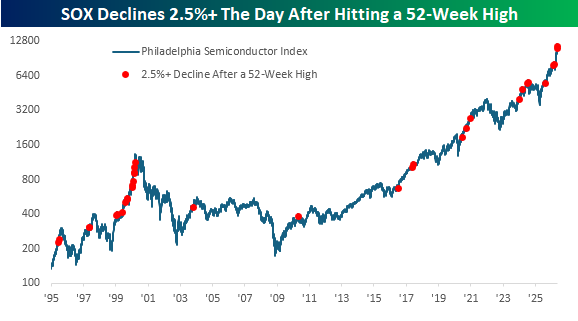
We were curious to see how common it is for the SOX to fall more than 2.5% just one day after closing at an all-time high. Since 1995, it’s happened 23 other times. You know when the last occurrence was? Last Thursday! It was also the fourth occurrence this year.
The chart below shows each prior occurrence with a red dot. While there were certainly other occurrences spread sporadically over the years, the only other time they were as frequent as the last five years were during the mid-1990s, right up to the 2000 peak. That’s a parallel that has come up a lot lately, with the trillion-dollar question being where we are in that comparison – 1998 or early 2000.
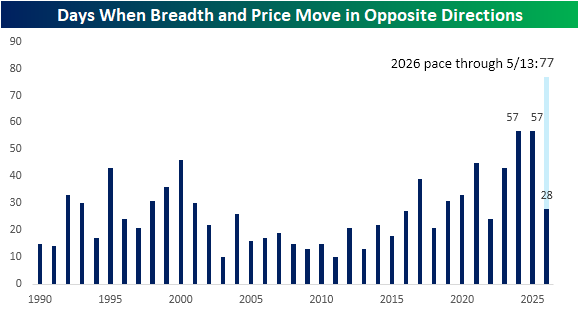
We’ve discussed the lack of strong market breadth on up days several times in recent weeks, but yesterday we saw the opposite as the S&P 500 declined even as its net advance/decline line was positive. That divergence marked the third straight day and the 28th time this year that price and breadth moved in opposite directions.
The chart below shows the frequency of days by year when price and breadth diverged. Over the last ten years, we’ve seen a steady increase in the number of occurrences, and in both 2024 and 2025, the S&P 500 saw a record number of divergent days. As mentioned above, we’ve already seen 28 occurrences this year. If that pace continues, this year’s total would spike up to 77, far eclipsing the records of the prior two years.
Start a two-week trial to Bespoke Premium to continue reading today’s full Morning Lineup.
The Closer – Overbought, Metals, CPI – 5/12/26
Log-in here if you’re a member with access to the Closer.
- The Nasdaq 100 reached a 14-day RSI reading above 80 each of the past two days.
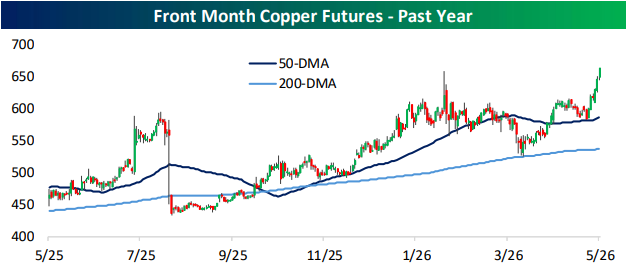
- Copper rose to a new 52-week high while silver has also begun to move higher. The chart for gold is looking less constructive.
- CPI saw the second largest leap in core prices since 2023, however, that acceleration was entirely due to vagaries of the rent calculation.
See today’s full post-market Closer and everything else Bespoke publishes by starting a 14-day trial to Bespoke Institutional today!
Earnings High Fliers and Busts
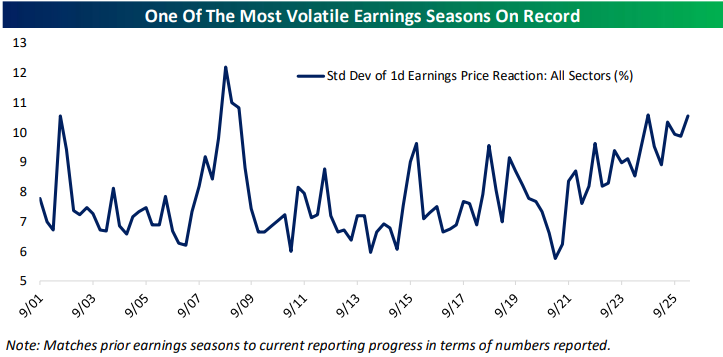
More than 1,500 stocks have reported earnings since the current season began in mid-April, and the average stock that has reported has seen an average absolute one-day share price reaction of roughly 7%. This means that the average stock is seeing its value change by +/-7% on the first trading day following its quarterly earnings report. That’s a big move!
In general, stocks have been getting more volatile on earnings in the last few years. Below is a chart highlighting earnings-day volatility for US stocks going back to 2001 using data from our Earnings Explorer tool.
The last time we saw earnings vol spike was during the Financial Crisis bear market when stocks were tanking. This time around, we’re seeing earnings vol increase during a strong AI-driven bull market. Should we chalk this up as another example of how AI is disrupting things?
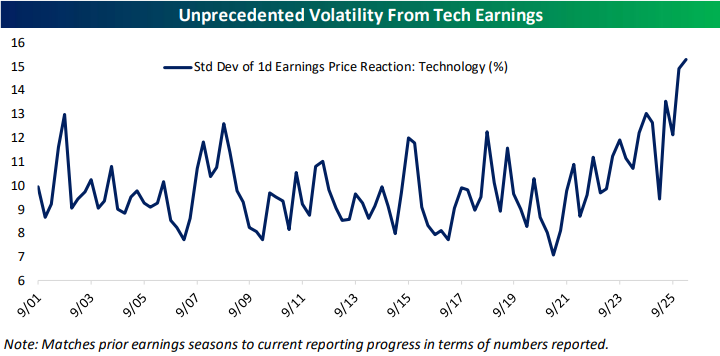
Below is a look at earnings-day volatility for Tech stocks specifically. During the Financial Crisis years when the average stock was seeing record earnings-day vol, Tech stocks didn’t see quite the same impact.
Now, though, Tech stocks are seeing record earnings-day volatility as investors and traders presumably make snap judgements about AI’s future impact on the bottom line.
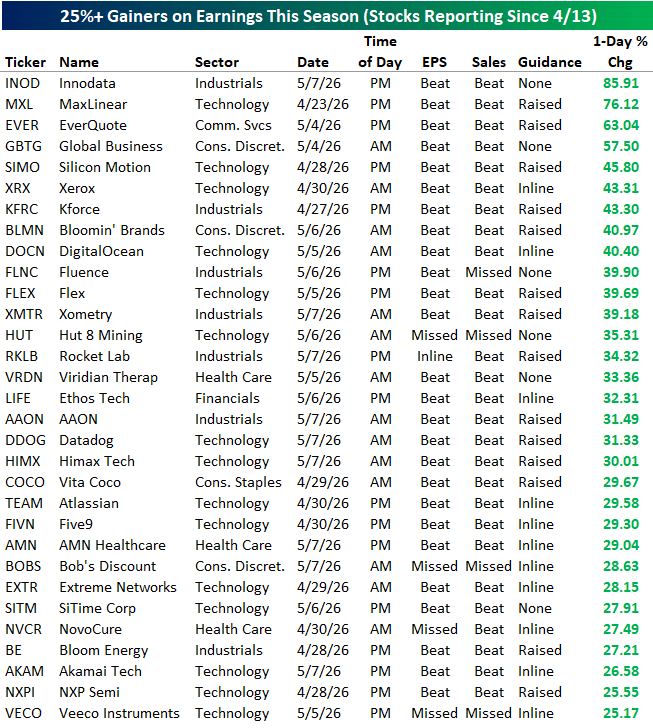
Speaking of earnings volatility, below are the 31 stocks that have seen one-day rallies of more than 25% following earnings this season. Nineteen stocks have gained more than 30% and four have gained 50%+!
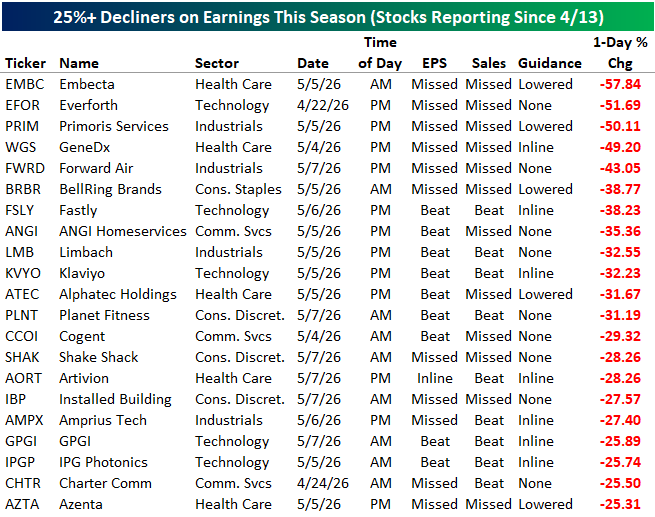
On the flip side, below are the 21 stocks that have fallen more than 25% on their earnings reaction days this season, including three that were cut in half:
Want to read more in-depth market analysis from Bespoke? Join our Think BIG mailing list or Bespoke Premium by starting a trial today! Click below for details on how to sign up for Premium:
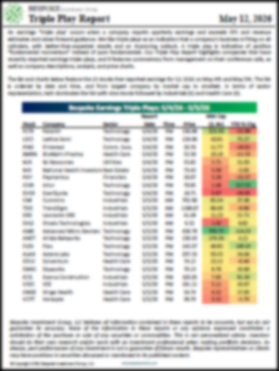
The Triple Play Report: 5/12/26
An earnings triple play is a stock that reports earnings and manages to 1) beat analyst EPS estimates, 2) beat analyst sales estimates, and 3) raise forward guidance. You can read more about “triple plays” at Investopedia.com where they’ve given Bespoke credit for popularizing the term. We like triple plays as an indication that a company’s business is firing on all cylinders, with better-than-expected results and an improving outlook. A triple play is indicative of positive “fundamental momentum” instead of pure fundamentals, and there are always plenty of names with both high and low valuations on our quarterly list.
Bespoke’s Triple Play Report covers what each company does, what this quarter’s results say about their growth outlooks, and their histories of delivering triple plays. Bespoke’s Triple Play Report is available at the Bespoke Institutional level only. You can sign up for Bespoke Institutional now and receive a 14-day trial to read today’s Triple Play Report. To sign up, choose either the monthly or annual checkout link below:
Bespoke Institutional – Monthly Payment Plan
Bespoke Institutional – Annual Payment Plan
Bespoke Investment Group, LLC believes all information contained in these reports to be accurate, but we do not guarantee its accuracy. None of the information in these reports or any opinions expressed constitutes a solicitation of the purchase or sale of any securities or commodities. This is not personalized advice. Investors should do their own research and/or work with an investment professional when making portfolio decisions. As always, past performance of any investment is not a guarantee of future results. Bespoke representatives or clients may have positions in securities discussed or mentioned in its published content.
Tech’s Spectacular Superlatives
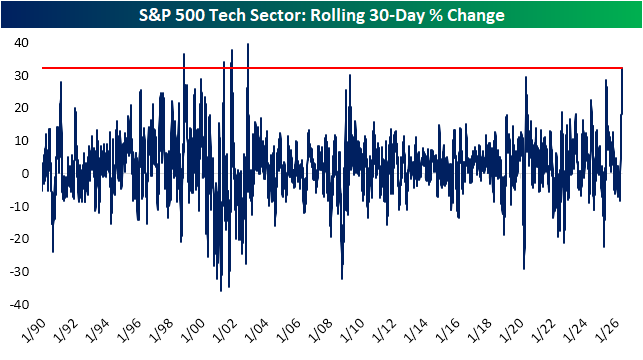
It has now been 30 trading days since the Iran War low on March 30th, and in that time, Tech has become the clear star of the rally, racking up superlatives left and right. We have highlighted many of these superlatives in our Daily Sector Snapshots in the past several days, and below we show the charts for some of those stats.
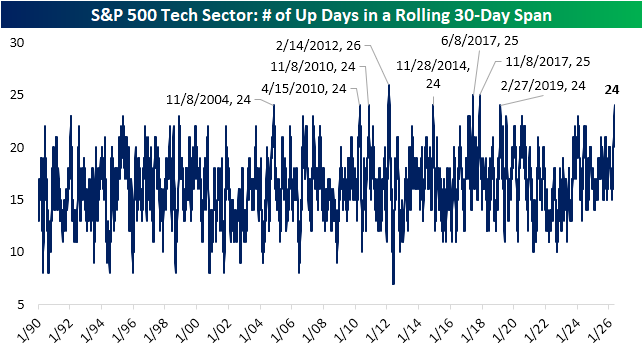
To start, it may feel like Tech rallies just about every day since that low, and that’s almost correct. In the 30 sessions since the low, Tech has posted a daily gain on 24 of those days. As shown below, that is the most consistent stretch of daily gains in 30 days since February 2019. Going back to 1990, there have only been seven other (eight, including that 2019 instance) examples of Tech rallying for at least 24 of 30 sessions. Surprisingly, not a single one of those was during the Dot Com boom and bust. In fact, the first example wasn’t until late 2004.
That begs the question: how much is Tech up over those 30 days? The answer is over 30% thanks to the sector averaging daily gains of 0.91% during that time. That is now the largest 30-session rally since November 2002. Other than that, the only other handful of larger 30-day rallies were in 1998 and 2001.
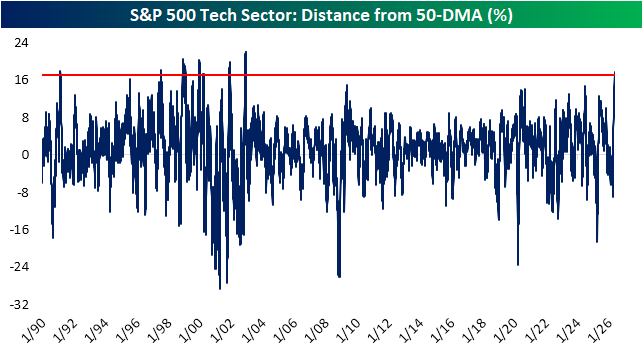
The rapid move higher in Tech stocks has, as might be expected, left moving averages far behind and once again earns superlatives. As of yesterday’s close and recent high, Tech was over 17% above its 50-DMA. That is once again, a reading unlike anything seen since November 2002, and the only other examples of such extended prices were during the late 1990s/early 2000s (in addition to one other example in 1991).
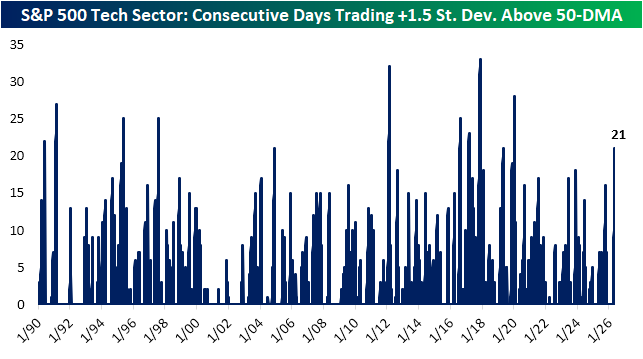
While Tech is extremely extended in percentage terms, conditions are less extreme when looking at the 50-DMA spread in terms of standard deviations. Tech has been overbought (at least one standard deviation above the 50-day) every session since April 13th. Since April 14th, Tech has been deeply overbought, trading at least 1.5 standard deviations above that moving average. As shown below, that 21-day streak is now the longest since January 2020.
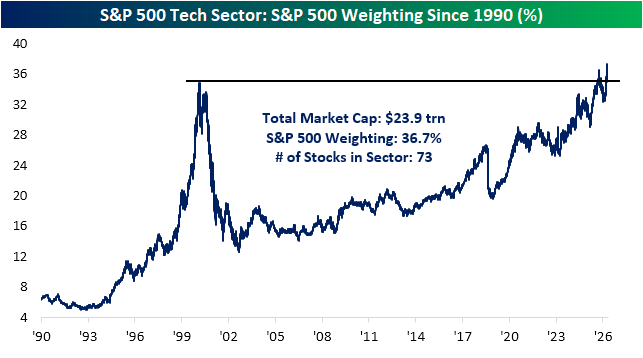
Finally, we would note that the latest rally didn’t only result in new highs for price. Tech has been the longstanding number one sector in terms of its weight in the S&P 500. Today, the sector accounts for 36.7% of the S&P 500’s total market cap, and as of yesterday’s close, it topped 37% for the first time on record.
Like this analysis? Join our premium members by starting a trial today! Click below for details on how to sign up:
Dirty SOX
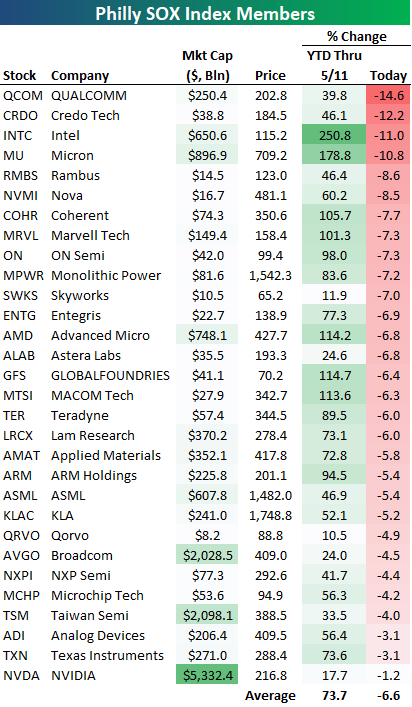
It wasn’t a matter of “if” the semis would see a short-term pull back, but “when.” The 30 semiconductor stocks in the Philadelphia SOX index were up an average of 73% year-to-date through yesterday (5/11). As shown at the bottom of the table below, they’re down an average of 6.6% in early afternoon trading today.
While NVIDIA (NVDA) has been one of the smallest gainers in the SOX this year, it’s down the least of any stock in the index today with a decline of just 1.2%.
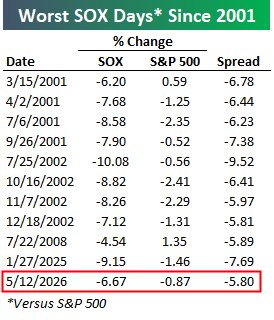
The SOX was down 6.67% today at around 1 PM ET while the S&P 500 was down 0.87%. That 5.8 percentage point spread of underperformance for the SOX would be its worst day versus the market since “DeepSeek Monday” last January 27th and the 3rd worst since 2003.
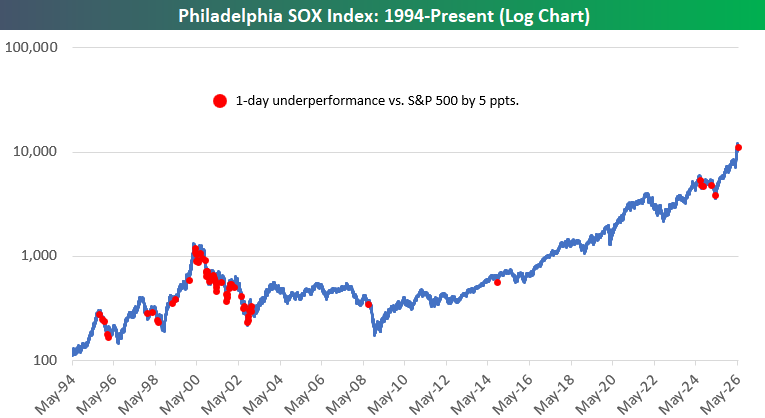
If you’re interested in historical precedent, below is a log chart of the SOX since 1994 with red dots marking the 64 trading days since then that the index has underperformed the S&P 500 by more than 5 percentage points:
Want to read more in-depth market analysis from Bespoke? Join our Think BIG mailing list or Bespoke Premium by starting a trial today! Click below for details on how to sign up for Premium:
Bespoke’s Morning Lineup – 5/12/26 – CPI Looms
See what’s driving market performance around the world in today’s Morning Lineup. Bespoke’s Morning Lineup is the best way to start your trading day. Read it now by starting a two-week trial to Bespoke Premium. CLICK HERE to learn more and start your trial.
“And so castles made of sand fall into the sea, eventually.” – Jimi Hendrix
Below is a snippet of commentary from today’s Morning Lineup. Start a two-week trial to Bespoke Premium to view the full report.
As prospects for a peace deal in Iran dwindle, traders are reducing risk as crude oil prices push higher and equity futures decline. The S&P 500 is on pace to open down 0.34%, while the Nasdaq is down more than twice that 0.71% as the hottest area of the markets experiences the most profit-taking. Crude oil prices are up over 4% as WTI trades back above $100 and Brent pushes towards $108. Gold prices are down about 0.5%, and Bitcoin is down 1.7% but still above $80K.
Lower odds of a peace deal have a more negative impact on Europe, and the STOXX 600 is down 0.70%, with Germany down over 1%. In Asia, the picture was mixed. The Nikkei rallied 0.5%, but Hong Kong, China, and South Korea all traded lower, with the latter falling the most (-2.3%). The decline in South Korea followed a proposal from a policymaker suggesting the country should pay citizens a ‘dividend’ using taxes on profits from AI-related industries.
Small business sentiment was released earlier this morning, and while the headline index was weaker than expected, it showed a modest increase relative to last month. The big report of the day, though, will be April’s CPI at 8:30. Economists expect the headline index to increase 0.6% with the core reading expected to jump 0.3%. While the market expects sizable increases to both indices, we would note that there hasn’t been a report yet this year where headline or core CPI was higher than expected.
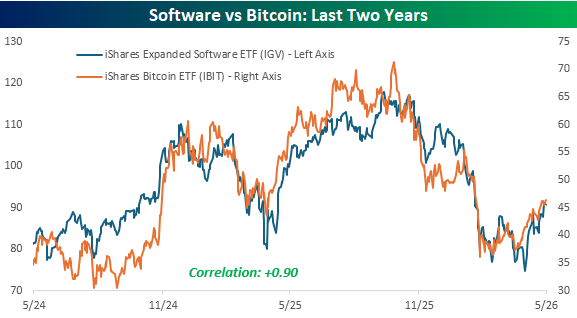
With everyone seemingly focused on Iran and semiconductors, Bitcoin has quietly carved out what increasingly looks like a bottom and the early stages of what could be an emerging uptrend. Since its intraday low in early February, the OG cryptocurrency has made a series of higher highs and higher lows. In early April, the price broke its downtrend from last year’s high, which also coincided with short-term resistance. Just to get back to even for the year, though, the Bitcoin ETF (IBIT) would need to rally more than 7% from yesterday’s close (8%+ from pre-market levels), and it’s still more than 35% below its 52-week high which would require a rally of 55% to get back to.
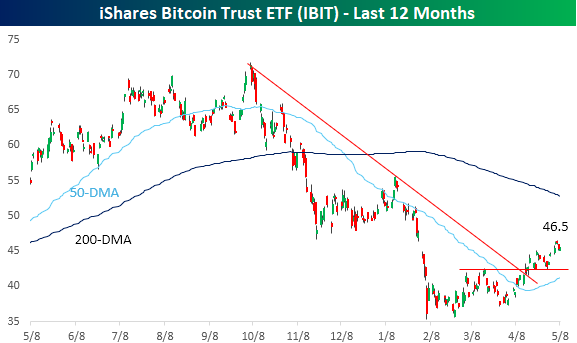
The direction of Bitcoin could be an important tell for one of the most beaten-down groups in the market, as the iShares Software ETF (IGV) has traded practically in lockstep with Bitcoin over the last two years. They’ve had their ups and downs, but IBIT and IGV have one of the closest relationships of any two major non-index ETFs, with a correlation of +0.90.
Start a two-week trial to Bespoke Premium to continue reading today’s full Morning Lineup.
The Closer – Big Reactions, Small Cap Impacts, Housing – 5/11/26
Log-in here if you’re a member with access to the Closer.
- Triple plays have been common and rewarded handsomely so far this earnings season with average stock price reactions ranking in the 93rd percentile.
- Top heaviness has been present in small cap stocks with a massive portion of the gains since relative performance lows last August.
- Mortgage foreclosures rose to the highest level since December 2019 even though overall delinquencies fell to a five month low in March.
See today’s full post-market Closer and everything else Bespoke publishes by starting a 14-day trial to Bespoke Institutional today!
Documenting the Rally
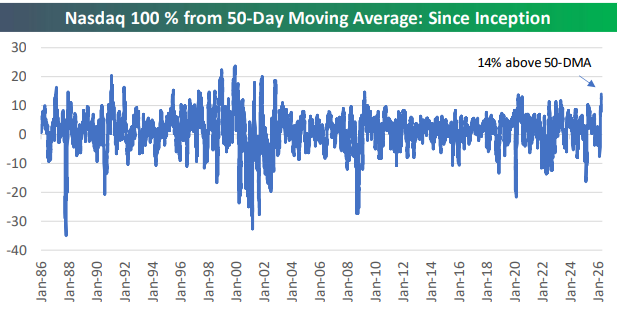
The S&P 500 is now up more than 17% since its late March low, and it’s 7% above its 50-day moving average. The tech-heavy Nasdaq 100 is double that at 14% above its 50-DMA!
As shown below, the last time the Nasdaq was this far above its 50-DMA was in late 2009 in the early days of the post-Financial Crisis recovery.
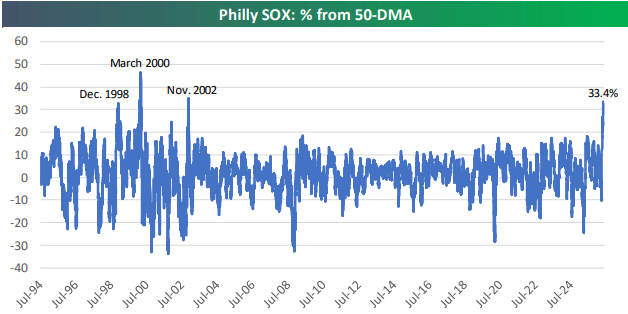
Within Tech, the Semis continue to soar to levels not seen since the Dot Com Boom and Bust of the late 1990s/early 2000s.
As shown below, the Philadelphia SOX semis index is currently 33% above its 50-DMA, a level only hit three other times: December 1998, March 2000, and November 2002.
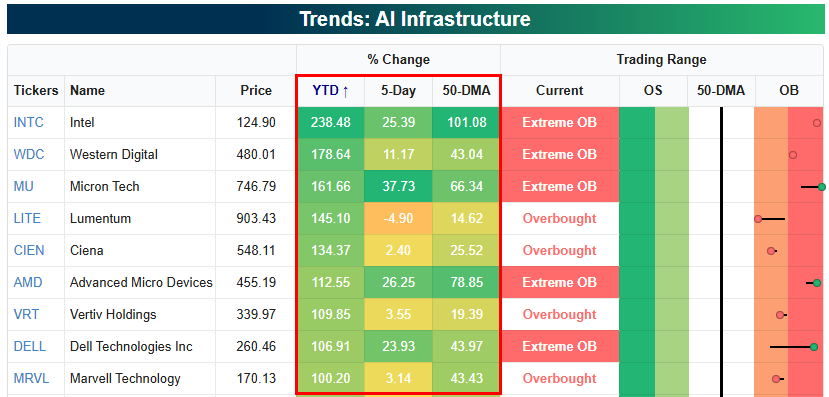
Below is a look at the best performing stocks this year in our AI Infrastructure basket (available with a Bespoke Institutional membership). There are nine stocks up more than 100% already!
Want to read more in-depth analysis of the recent rally for Tech? Join our Think BIG mailing list or Bespoke Premium by starting a trial today! Click below for details on how to sign up for Premium: