The Closer – Central Banking, Mega Cap Earnings – 1/29/25
Log-in here if you’re a member with access to the Closer.
Looking for deeper insight into markets? In tonight’s Closer sent to Bespoke Institutional clients, we start out with a recap of the latest news in central banking including today’s FOMC decision (page 1) in addition to how the market reacted (page 2). Next, we dive into the details of key earnings reports from MSFT, META, IBM, and TSLA (pages 3 and 4). (pages 3 and 4). We close out with a look at the most recent update to petroleum stockpiles (page 5).

See today’s full post-market Closer and everything else Bespoke publishes by starting a 14-day trial to Bespoke Institutional today!
Q4 2024 Earnings Conference Call Recaps: Royal Caribbean (RCL)
Bespoke’s Conference Call Recaps use AI to summarize lengthy earnings calls. The commentary below is AI-generated and then edited by Bespoke for quality control. As always, none of these summaries should be construed as recommendations to buy or sell any securities, and investors should do their own research and/or consult with a financial professional before making any investment decisions.
Our latest recap available to Bespoke subscribers covers Royal Caribbean’s (RCL) Q4 2024 earnings call.
![]()
Royal Caribbean (RCL) is the world’s largest cruise line with renowned brands like Royal Caribbean International, Celebrity Cruises, and Silversea Cruises. For Q4, RCL reported 7.3% net yield growth, driven by strong bookings and onboard spending. The company introduced Celebrity River Cruises, launching in 2027 with 10 new ships, signaling an entry into the high-margin river cruise market. Private destination investments, including the Nassau Beach Club opening in late 2025, serve to boost guest satisfaction and yield. AI-powered personalization and other technology reduced booking times by 50%. Strong consumer demand, driven by high wages and a focus on experiences, led to record-breaking bookings and higher APDs for 2025. Fleet expansion continues with Icon of the Seas and Utopia of the Seas driving growth, while loyalty programs improve guest retention. RCL shares traded more than 13% higher on 1/28 after the record-breaking quarter…
Continue reading our Conference Call Recap for RCL by becoming a Bespoke Institutional subscriber. You can sign up for Bespoke Institutional now and receive a 14-day trial to read our newest Conference Call Recap. To sign up, choose either the monthly or annual checkout link below:
Bespoke’s Morning Lineup — 1/29/25
See what’s driving market performance around the world in today’s Morning Lineup. Bespoke’s Morning Lineup is the best way to start your trading day. Read it now by starting a two-week trial to Bespoke Premium. CLICK HERE to learn more and start your trial.
“Discrepancies – and hence opportunities – in securities originate most often when events move faster than quotations.” – Benjamin Graham

Below is a snippet of commentary from today’s Morning Lineup. Start a two-week trial to Bespoke Premium to view the full report.
Markets bounced back on Tuesday from Monday’s DeepSeek drop, and the S&P is entering Wednesday trading down just 58 bps on the week. Investors sold first and asked questions later on Monday, but once they did start asking questions, it seems as if cooler heads might be starting to prevail.
While AI Infrastructure stocks have fallen this week, the DeepSeek news has caused investors to contemplate an overall lower cost to compute on the AI front, which should benefit margins for companies in the AI Implementation space and also increase overall demand from consumers in the long run.
As shown below, NVDA’s drop in market cap this week has mostly been offset by gains in market cap for the other major mega-cap Tech and Tech-adjacent stocks. Apple (AAPL), Amazon (AMZN), Alphabet (GOOGL), Meta (META), and Microsoft (MSFT) have seen a combined increase in market cap of $299 billion so far this week, while NVDA has seen a drop of $334 billion. On a net basis, the market cap for all six of these behemoths has only fallen $34.8 billion on the week.

Below is a quick snapshot of the six mega-caps mentioned above run through our Trend Analyzer tool. While NVIDIA (NVDA) is down 8.4% over the last week and in oversold territory, Meta (META) and Apple (AAPL) are both up more than 7%.

The Closer – Impoundments, Earnings, Confidence – 1/28/25
Log-in here if you’re a member with access to the Closer.
Looking for deeper insight into markets? In tonight’s Closer sent to Bespoke Institutional clients, we lead off with commentary regarding the Office of Management and Budget’s memo (page 1) followed by a dive into the latest earnings reports (pages 2 and 3). We also review the latest Consumer Confidence data (page 4) before closing out with a look at another strong 7-year note auction (page 5).

See today’s full post-market Closer and everything else Bespoke publishes by starting a 14-day trial to Bespoke Institutional today!
Q4 2024 Earnings Conference Call Recaps: American Express (AXP)
Bespoke’s Conference Call Recaps use AI to summarize lengthy earnings calls. The commentary below is AI-generated and then edited by Bespoke for quality control. As always, none of these summaries should be construed as recommendations to buy or sell any securities, and investors should do their own research and/or consult with a financial professional before making any investment decisions.
Our latest recap available to Bespoke subscribers covers American Express’ (AXP) Q4 2024 earnings call.
![]()
American Express (AXP) is celebrated for its premium charge and credit cards, travel-related offerings, and payment solutions. Catering primarily to affluent consumers, small businesses, and global enterprises, the company provides an array of products and services designed to boost spending, borrowing, and travel experiences. Its reputation for excellence and exclusivity has appealed to millennials and Gen Z consumers, who have been a driving force of AXP’s for several quarters now. AXP closed the year with record revenues of $66 billion, up 10% on an FX-adjusted basis, driven by a surge in premium cardholder spending and holiday-season billings growth of 8%. The company saw record net card fees, 13 million new card acquisitions, and 16% Q4 spending growth among millennial and Gen Z customers. SME spending rose 3%, supported by stronger small business sentiment. Travel and entertainment spending grew nicely, with airline travel up 13% and front-of-cabin bookings up 19%. International markets grew 15%, aided by an expanded merchant network. Looking to 2025, AXP expects 8–10% revenue growth and plans to refresh 35–50 products. After topping estimates on strong spending activity, AXP shares fell more than 2% on 1/24 as guidance came in lower than investors would have liked after a solid 2024…
Continue reading our Conference Call Recap for AXP by becoming a Bespoke Institutional subscriber. You can sign up for Bespoke Institutional now and receive a 14-day trial to read our newest Conference Call Recap. To sign up, choose either the monthly or annual checkout link below:
Q4 2024 Earnings Conference Call Recaps: Intuitive Surgical (ISRG)
Bespoke’s Conference Call Recaps use AI to summarize lengthy earnings calls. The commentary below is AI-generated and then edited by Bespoke for quality control. As always, none of these summaries should be construed as recommendations to buy or sell any securities, and investors should do their own research and/or consult with a financial professional before making any investment decisions.
Our latest recap available to Bespoke subscribers covers Intuitive Surgical’s (ISRG) Q4 2024 earnings call.
![]()
Intuitive Surgical (ISRG) operates within robotic-assisted surgery, best known for its da Vinci Surgical System, which helps make minimally invasive procedures possible. The company also offers complementary platforms like Ion for lung biopsies and SP for single-port surgeries. With over 2.6 million procedures performed annually using its systems, the company offers insights into advancements in surgical precision with cutting-edge technologies like force feedback and augmented reality tools. This quarter, ISRG saw 25% revenue growth as the da Vinci 5 platform saw 362 systems placed globally and 32,000 procedures performed in its first year. Ion procedures grew 78%, and SP saw 81% growth. Procedure growth reached 17% overall, led by general surgery in the US and thoracic and benign indications internationally, though bariatric procedures declined due to GLP-1 medications. Challenges in China and Europe, including regulatory and budget constraints, tempered growth. Despite beating estimates, ISRG shares fell more than 4% on 1/24 on weaker guidance…
Continue reading our Conference Call Recap for ISRG by becoming a Bespoke Institutional subscriber. You can sign up for Bespoke Institutional now and receive a 14-day trial to read our newest Conference Call Recap. To sign up, choose either the monthly or annual checkout link below:
New York Home Prices on Top
Updated home price data from S&P CoreLogic Case Shiller was published this morning through the month of November 2024. Below is a summary table of key results across the 20 cities/regions tracked by Case Shiller.
Most cities saw home prices decline month-over-month from October to November, with San Francisco and Seattle down the most at roughly -0.75%. Boston, Miami, and New York were the only cities that saw meaningful gains month-over-month.
Over the prior year, 19 of 20 cities were up, with Tampa the only city down at -0.37%.
New York ranks first when it comes to year-over-year price gains at +7.32%.
After a major jump in home prices in the immediate aftermath of the pandemic, we saw a small dip in 2022 and 2023 when risk assets sold off hard. Since early 2023 lows, New York is also the city that has seen home prices jump the most at +16.76%.
Additionally, New York is now the only city where home prices are currently at all-time highs. On the flip side, San Francisco, Seattle, and Denver are all down more than 5% from all-time highs.

Below is a historical look at Case Shiller home prices for the 20 cities tracked along with the composite indices. We’ve highlighted New York in green because it’s the only city where prices are at all-time highs.


A Discerning Sell-Off
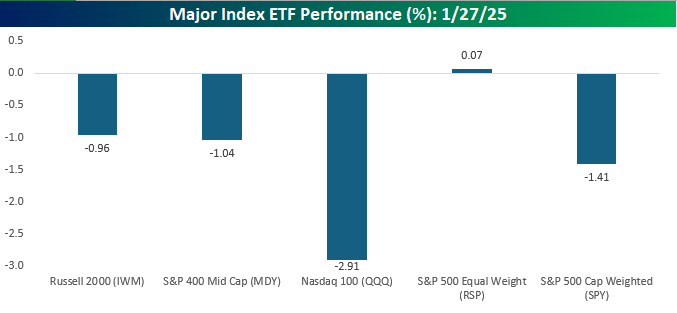
In listening to discussions over the market’s reaction to the DeepSeek sell-off yesterday, the term “shoot first, ask questions later” came up repeatedly. However, in looking at the performance of various indices and individual stocks yesterday, the market’s behavior looked more discerning than indiscriminate. At the individual stock level, most stocks in the S&P 500 finished the day higher, and the weakness was concentrated to stocks that have benefitted the most from the AI rally.
The chart below shows yesterday’s performance of major US index ETFs. As you would expect, the Nasdaq 100 with its concentration in technology was the hardest hit, falling by close to 3%. The cap-weighted S&P 500 (SPY) also declined more than 1% given its large weighting in Nvidia (NVDA) and other tech companies. The equal-weight index (RSP), however, finished the day in positive territory with a modest gain. The one index where performance was not as we expected was in small caps where the Russell 2000 (IWM) also fell nearly 1%. On a day when mega-cap tech was crushed but the majority of large-cap stocks rallied and interest rates declined, we would have expected small caps to show more strength. Given the entire Russell 2000 is smaller than NVDA, it doesn’t take much to get this area of the market to rally. Also, if DeepSeek means that the previous costs associated with adopting AI are now dramatically lower, shouldn’t that be good for small caps which presumably have smaller budgets?
Looking at the performance of these major index ETFs over the last week, outside of QQQ, they’re all still positive, even after Monday’s decline. Additionally, they’re also all trading right within the confines of their normal trading ranges (none are oversold or overbought) which is a level of homogeneity that it feels like we don’t see much these days.

The Russell 2000’s lack of a rally came within the context of a week-long period where IWM has been unsuccessfully attempting to break back above its 50-DMA. Yesterday marked the fifth straight day where it tested that level but failed to close above it.

The mid-cap ETF (MDY) finished well off its intraday high yesterday and also traded below its 50-DMA but managed to close the day just barely above that level.

The 50-DMA also acted as support for the S&P 500. After opening right at that level in the morning, the large-cap benchmark bounced throughout the session and finished at the highs of the session.

The chart of the Equal Weight S&P 500 (RSP) over the last few days looks similar to small caps with a tight range. The only difference is that, unlike IWM, RSP has closed above its 50-DMA for each of the last four trading days.

Finally, the Nasdaq 100 (QQQ) was the biggest pain point of the major indices. It started the session below its 50-DMA and made an attempt to rally back above that level intraday but came up just short by the time the closing bell rang. While QQQ failed to take out its December high in last week’s rally, it did manage a higher high, and as long as yesterday’s decline doesn’t see much in the way of follow-through, it isn’t in imminent danger of a lower low in the short-term.

Bespoke’s Morning Lineup – 1/28/25
See what’s driving market performance around the world in today’s Morning Lineup. Bespoke’s Morning Lineup is the best way to start your trading day. Read it now by starting a two-week trial to Bespoke Premium. CLICK HERE to learn more and start your trial.
“Profitability is coming from productivity, efficiency, management, austerity, and the way to manage the business.” – Carlos Slim
Below is a snippet of commentary from today’s Morning Lineup. Start a two-week trial to Bespoke Premium to view the full report.
Even though the S&P 500 was down 1.4% yesterday, there were 351 advancers and just 152 decliners within the index. As shown below, Technology, Utilities, and Industrials pretty much saw all of the pain, while Consumer Staples and Health Care were actually up more than 2%. All of the weakness yesterday came from declines in the companies that deal with producing and powering AI.

NVIDIA (NVDA) ended last week as the largest company in the world with a market cap of roughly $3.5 trillion. It ended Monday with a market cap of $2.9 trillion and now ranks as the third largest company behind Apple (AAPL) and Microsoft (MSFT). Since last Thursday’s close, NVIDIA (NVDA) has lost $705 billion in market cap!

The Closer – AI’s Bad Day – 1/27/25
Log-in here if you’re a member with access to the Closer.
Looking for deeper insight into markets? In tonight’s Closer sent to Bespoke Institutional clients, we lead off with some commentary regarding the situation with Colombia and the latest earnings (page 1). We also start out with a look at some stocks impacted by the AI hit (page 2) in addition to new home sales data (page 3). We then review the historic divergences in breadth and price in addition to the Tech and Consumer Staples sectors (page 4). We then pivot over to the record single day decline in our AI baskets (page 5) and put a bow on the topic on the following page (page 6). We finish by reviewing today’s Treasury auctions (page 7). We then finish with a recap of the latest positioning data (pages 8 – 11).

See today’s full post-market Closer and everything else Bespoke publishes by starting a 14-day trial to Bespoke Institutional today!