The Closer – Uncertainty, Implementation Implodes, KISS – 2/27/25
Log-in here if you’re a member with access to the Closer.
Looking for deeper insight into markets? In tonight’s Closer sent to Bespoke Institutional clients, we begin with a look at the enormous number of mentions on tariffs on conference calls and what that means for uncertainty (page 1). We then review the latest GDP data (page 2) and earnings reports released after the bell (page 3). Next, we review the sharp drop in AI names (page 4) followed by an update of our KISS basket (page 5).

See today’s full post-market Closer and everything else Bespoke publishes by starting a 14-day trial to Bespoke Institutional today!
Q4 2024 Earnings Conference Call Recaps: eBay (EBAY)
Bespoke’s Conference Call Recaps use AI to summarize lengthy earnings calls. The commentary below is AI-generated and then edited by Bespoke for quality control. As always, none of these summaries should be construed as recommendations to buy or sell any securities, and investors should do their own research and/or consult with a financial professional before making any investment decisions.
Our latest recap available to Bespoke subscribers covers eBay’s (EBAY) Q4 2024 earnings call.
![]()
eBay (EBAY) operates one of the world’s largest online marketplaces, connecting buyers and sellers across categories, from collectibles and fashion to electronics and auto parts. Unlike traditional e-commerce giants, eBay specializes in consumer-to-consumer (C2C) and enthusiast-driven commerce, offering a platform for secondhand and unique inventory. The company’s deep AI investments include proprietary large language models, enhanced search, pricing, and listing optimization, while its global partnerships, including integrations with OpenAI and Meta, expand its reach. EBAY delivered 2% GMV growth to $19.3B, led by Trading Cards (double-digit growth) and Motors Parts & Accessories. AI-powered features propelled seller adoption, with over 10 million using Gen AI tools. Advertising revenue climbed 12% to $445M, countering take rate pressures. Consumer demand held steady in the US but remained weak in the UK/Germany, with macro concerns around tariffs and de minimis rule changes ahead. Despite challenges, eBay sees low single-digit GMV growth for 2025, prioritizing AI, category expansion, and seller monetization. Despite beating estimates, EBAY fell as much as 10% on 2/27 on light guidance…
Continue reading our Conference Call Recap for EBAY by becoming a Bespoke Institutional subscriber. You can sign up for Bespoke Institutional now and receive a 14-day trial to read our newest Conference Call Recap. To sign up, choose either the monthly or annual checkout link below:
Claims in the Capital
It was a big day for scheduled Thursday releases. For starters, weekly sentiment data showed a huge spike in bearish sentiment (which we covered in today’s Chart of the Day and Morning Lineup), and among the economic data releases, jobless claims experienced a notable spike. For seasonally adjusted initial claims through the week of 2/22, claims totaled 242K, up 22K from the previous week’s upward revision of 220K. As shown below, at those levels, claims have returned to the upper end of the past few years’ range with this marking the largest single-week increase since a 35K surge in October.

Before seasonal adjustment, claims totaled 220.5K. That is up versus the comparable week of the past two years and is more in line with levels from February 2022, meaning that claims are up relative to recent years but not extraordinarily high. On the bright side, claims are moving in line with seasonally normal patterns, as shown in the second chart below. Claims will likely continue to have these seasonal tailwinds out through the spring.

Nationally, claims are higher, but it is hard to classify it as too much of a concern- yet. Additionally, state-level data offers some insight into the uptick. Among many changes, thanks to the new administration taking office, the federal government has been getting a shake-up from audits from the Department of Government Efficiency (DOGE). There have already been job losses as a result of these attempts to curtail government spending, which is showing up through DC area claims. We first noted the increase in claims in the Washington DC metro area in last Thursday’s Closer, and the updated data one week later has reaffirmed more jobs have been lost. As shown below, claims from the capital have risen above 2,000 for the first time since Q1 2023, which was around the time of a looming debt ceiling standoff. Before that, the only other spikes of similar size or larger were the COVID period and the 2018-2019 government shutdown.

Of course, looking at claims in the DC area is only one proxy for the loss in government jobs. The Department of Labor also offers a look at claims filed in federal programs. These, of course, are a more direct look at government job loss. As shown in the first chart below, federal employee claims have generally trended lower over the past 15 or so years, having been near record lows (at the time of seasonal annual lows) in the past several years. This time of year usually sees an unwinding of a seasonal spike in claims, but this year, the opposite has been playing out, with claims continuing to move higher in the past couple of weeks.
In fact, the four-week moving average for federal employee claims has risen over 40% on a year-over-year basis. As shown in the second chart below, that spike hardly registers when put up against things like government shutdowns and recessions. One comparable spike worth mentioning, though, is from early 2021, shortly after Biden took office. That was another period with a notable spike in federal claims thanks to hiring freezes and employment reductions due to policy shifts moving from one administration to another. In other words, the recent DOGE job cuts have some very recent parallels.
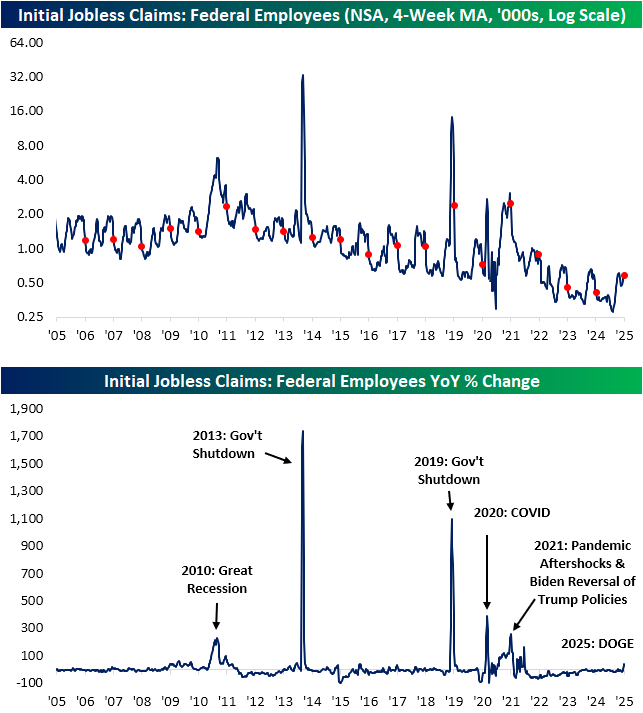
Obviously, it’s still early in the game. It’s only been a little more than a month since President Trump’s inauguration, so it wouldn’t be surprising to see government-related claims continue rising as DOGE continues its auditing. With that in mind, federal employee continuing claims are right about where they were for this time last year. Additionally, like initial claims, those levels are at a seasonal inflection point and are considerably lower than what they have been in past decades.


Q4 2024 Earnings Conference Call Recaps: NVIDIA (NVDA)
Bespoke’s Conference Call Recaps use AI to summarize lengthy earnings calls. The commentary below is AI-generated and then edited by Bespoke for quality control. As always, none of these summaries should be construed as recommendations to buy or sell any securities, and investors should do their own research and/or consult with a financial professional before making any investment decisions.
Our latest recap available to Bespoke subscribers covers NVIDIA’s (NVDA) Q4 2025 earnings call.
![]()
NVIDIA (NVDA) is the dominant force in AI computing, designing high-performance GPUs and data center solutions that power everything from gaming to deep learning. Its cutting-edge chips are at the heart of AI models, self-driving cars, and high-performance computing, making it an essential player in the AI revolution. NVDA reported another record quarter, with Q4 revenue hitting $39.3 billion, up 78% YoY, driven by soaring AI demand. The Blackwell GPU architecture ramped faster than any prior product, with $11 billion in Q4 sales, as hyperscalers race to build AI factories. Inference demand is growing quickly, with reasoning models like OpenAI’s GPT and DeepSeek-R1 requiring 100x more compute per task than traditional inference. Enterprise AI adoption doubled YoY, with industries from healthcare to finance leveraging NVIDIA’s stack. Networking revenue dipped 3% sequentially, but the transition to NVLink 72 and Spectrum-X is a major long-term growth vector. China sales stabilized at half pre-export control levels, while US demand climbed. NVDA expects Q1 revenue of $43 billion, with Blackwell accelerating further. On the triple play, the stock opened 2.7% higher on 2/27, but dipped negative intraday…
Continue reading our Conference Call Recap for NVDA by becoming a Bespoke Institutional subscriber. You can sign up for Bespoke Institutional now and receive a 14-day trial to read our newest Conference Call Recap. To sign up, choose either the monthly or annual checkout link below:
The Bespoke 50 Growth Stocks — 2/27/25
The “Bespoke 50” is a basket of noteworthy growth stocks in the Russell 3,000. To make the list, a stock must have strong earnings growth prospects along with an attractive price chart based on Bespoke’s analysis. There were 17 changes to the list this week.
The Bespoke 50 is available with a Bespoke Premium subscription or a Bespoke Institutional subscription. With Bespoke Premium, you’ll receive a number of daily market updates from us along with our weekly newsletter and a portion of our investor tools. With Bespoke Institutional, you’ll receive everything that’s included with Premium plus additional daily macro analysis and more stock-specific research.
To see all 50 stocks that currently make up the Bespoke 50, simply start a two-week trial to Bespoke Premium or Bespoke Institutional.

The Bespoke 50 performance chart shown does not represent actual investment results. The Bespoke 50 is updated monthly on Thursdays unless otherwise noted. Performance is based on equally weighting each of the 50 stocks (2% each) and is calculated using each stock’s opening price as of Friday morning after publication. Entry prices and exit prices used for stocks that are added or removed from the Bespoke 50 are based on Friday’s opening price. Any potential commissions, brokerage fees, or dividends are not included in the Bespoke 50 performance calculation, but the performance shown is net of a hypothetical annual advisory fee of 0.85%. Performance tracking for the Bespoke 50 and the Russell 3,000 total return index begins on March 5th, 2012 when the Bespoke 50 was first published. Past performance is not a guarantee of future results. The Bespoke 50 is meant to be an idea generator for investors and not a recommendation to buy or sell any specific securities. It is not personalized advice because it in no way takes into account an investor’s individual needs. As always, investors should conduct their own research when buying or selling individual securities. Click here to read our full disclosure on hypothetical performance tracking. Bespoke representatives or wealth management clients may have positions in securities discussed or mentioned in its published content.
Bespoke’s Morning Lineup – 2/27/25 – What Happened?
See what’s driving market performance around the world in today’s Morning Lineup. Bespoke’s Morning Lineup is the best way to start your trading day. Read it now by starting a two-week trial to Bespoke Premium. CLICK HERE to learn more and start your trial.
“I really try to put myself in uncomfortable situations. Complacency is my enemy.” – Trent Reznor

Below is a snippet of commentary from today’s Morning Lineup. Start a two-week trial to Bespoke Premium to view the full report.
Well, we made it through Nvidia (NVDA). The hype surrounding last night’s earnings report was as high as we can remember for any stock reporting earnings in the past and reminiscent of Cisco (CSCO), Intel (INTC), or Microsoft (MSFT) reports in the late 1990s, or Apple (AAPL) reports in more recent years. NVDA’s report wasn’t great, but it wasn’t bad either. The company managed to report better-than-expected EPS and sales, while slightly raising sales guidance. That was good enough for investors who had set the bar low in recent weeks. The stock is currently trading just about 2.5% higher in the pre-market, and Nasdaq and S&P 500 futures are riding its coattails trading higher by more than 0.5%.
Bulls will take it, but as the last few days have shown us, we’re in a market environment where what the market is doing right now is hardly indicative, no less a guarantee of where we’ll be an hour from now let alone the end of the day. Add to that a ton of economic data and several Fed speakers on the calendar, and it’s sure to be an eventful day!
What happened to sentiment? Everywhere you look, fear has set into the collective mood. Indices that measure economic uncertainty have shot up to record highs, even taking out their prior extremes from the early days of Covid. The latest measures of consumer sentiment from the University of Michigan and the Conference Board both also showed much larger than expected declines in their latest readings. But nowhere has the negative turn in sentiment been more pronounced than in the equity market.
The CNN Fear & Greed Index gauges stock market behavior by looking at momentum, breath, options activity, strength in the junk bond market, and demand for safe havens. As of this morning, the index was at 21, putting it in the “Extreme Fear” range.

Over the last year, the current level of the CNN Fear & Green Index is among the lowest. The only time it was lower was in early August when markets briefly sold off as the Japanese equity market crashed over 10% in a single day.

The Closer – Tariff Talk, NVDA Earnings, Gas Investment – 2/26/25
Log-in here if you’re a member with access to the Closer.
Looking for deeper insight into markets? In tonight’s Closer sent to Bespoke Institutional clients, we start out with some commentary regarding another round of tariff headlines (page 1) followed by an update on the latest earnings including results from NVIDIA (NVDA) in addition to multiple other big names (page 2). Then then discuss the latest investments from gas companies (pages 3 and 4). We finish be looking at new home sales (page 5), the 7-year note auction (page 6), and the latest EIA data (page 7).

See today’s full post-market Closer and everything else Bespoke publishes by starting a 14-day trial to Bespoke Institutional today!
Q4 2024 Earnings Conference Call Recaps: TJX (TJX)
Bespoke’s Conference Call Recaps use AI to summarize lengthy earnings calls. The commentary below is AI-generated and then edited by Bespoke for quality control. As always, none of these summaries should be construed as recommendations to buy or sell any securities, and investors should do their own research and/or consult with a financial professional before making any investment decisions.
Our latest recap available to Bespoke subscribers covers TJX’s (TJX) Q4 2025 earnings call.
![]()
TJX (TJX) is an off-price retailer of apparel and home goods, operating over 5,000 stores under brands like T.J. Maxx, Marshalls, HomeGoods, and Sierra in the US, Canada, Europe, and Australia. TJX posted a strong quarter, with 5% comp sales growth entirely driven by higher customer transactions, reinforcing its ability to attract shoppers across income levels. Shrink improvements added 70 basis points to margins. The company plans 130 new store openings in 2025, raising its long-term store target to 7,000 locations. While tariffs on China-sourced goods present a short-term headwind, TJX remains confident in its sourcing flexibility. E-commerce sales grew but remain a small part of the business. TJX shares were up roughly 2.5% on 2/26…
Continue reading our Conference Call Recap for TJX by becoming a Bespoke Institutional subscriber. You can sign up for Bespoke Institutional now and receive a 14-day trial to read our newest Conference Call Recap. To sign up, choose either the monthly or annual checkout link below:
Q4 2024 Earnings Conference Call Recaps: Axon (AXON)
Bespoke’s Conference Call Recaps use AI to summarize lengthy earnings calls. The commentary below is AI-generated and then edited by Bespoke for quality control. As always, none of these summaries should be construed as recommendations to buy or sell any securities, and investors should do their own research and/or consult with a financial professional before making any investment decisions.
Our latest recap available to Bespoke subscribers covers Axon’s (AXON) Q4 2024 earnings call.
![]()
Axon (AXON) is best known for its TASER devices, body cameras, and evidence management software. The company’s Axon Cloud ecosystem integrates AI, drones, and real-time data to improve law enforcement and emergency response. AXON serves law enforcement agencies, federal and military clients, private security firms, and international markets. AXON closed 2024 with $2 billion in revenue, marking its third consecutive year of 30%+ growth. TASER 10 sales doubled TASER 7 adoption rates, and demand continues to outpace supply, and the company is investing to fix that imbalance. AI-driven solutions like Draft One (AI report-writing tool by analyzing body cam footage) and the AI Era Plan (premium subscription plan bundling AI tools) saw record adoption, with over 100,000 AI-generated reports completed. AXON’s international bookings grew 50% sequentially, while enterprise sales tripled. The Dedrone (counter-drone technology) acquisition and Skydio (autonomous drones) are helping the company respond to heightened border security and military demand. Meanwhile, political and legal hurdles in Arizona could force a headquarters relocation. AXON enters 2025 with over $10 billion in future contracted bookings, forecasting another 25% revenue growth year. The stock opened 18.2% higher on 2/26…
Continue reading our Conference Call Recap for AXON by becoming a Bespoke Institutional subscriber. You can sign up for Bespoke Institutional now and receive a 14-day trial to read our newest Conference Call Recap. To sign up, choose either the monthly or annual checkout link below:
Bespoke’s Morning Lineup – 2/26/25 – Separate Ways
See what’s driving market performance around the world in today’s Morning Lineup. Bespoke’s Morning Lineup is the best way to start your trading day. Read it now by starting a two-week trial to Bespoke Premium. CLICK HERE to learn more and start your trial.
“Greatness comes from character, and character is not formed out of smart people, it’s formed out of people who suffered.” – Jensen Huang
Below is a snippet of commentary from today’s Morning Lineup. Start a two-week trial to Bespoke Premium to view the full report.
After four days in a row of losses for the S&P 500 and Nasdaq, including three days in a row of 1%+ losses for the Nasdaq, bulls are getting a chance to catch their breath this morning as futures are higher across the board. The breather comes just in time as markets gear up for Nvidia’s (NVDA) earnings report after the close. How the market reacts to that report could give us a good idea of the market tone as we head into spring. Besides NVDA after the close, New Home Sales is the only economic report on today’s economic calendar, and we’ll also hear from Richmond Fed President Barkin at 8:30 and Atlanta Fed President Bostic at noon.
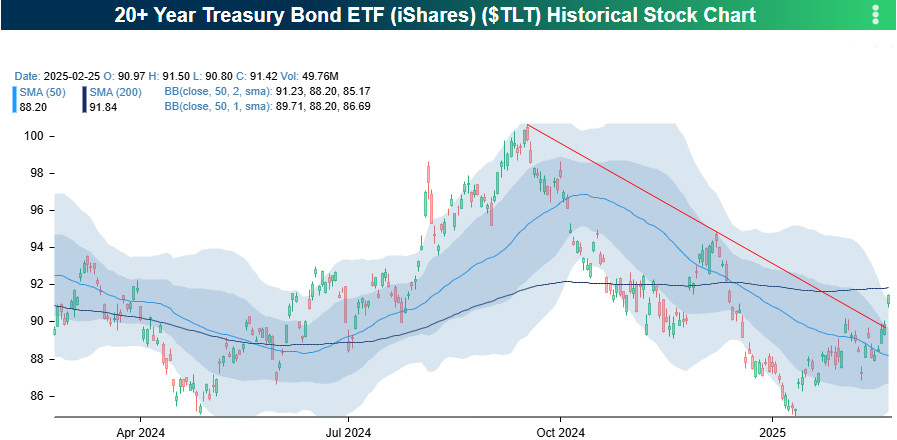
Everything has been turned upside down in the markets over the last week. While equities and bitcoin have pulled back sharply, fixed-income ETFs – especially treasuries – have surged. As shown in the snapshots from our Trend Analyzer, the US Aggregate Bond ETF (AGG) and every Treasury ETF with a maturity longer than a year has moved into extreme overbought territory (more than two standard deviations above their 50-day moving averages (DMA). On the equity side, the S&P 500 hasn’t quite reached oversold territory, but all the other major index ETFs along with Bitcoin have now moved at least into oversold territory. It seems like a while since we last saw a situation where fixed-income securities were moving to the right side of their ranges while equities were moving to the left.

The iShares 20+ year US Treasury ETF (TLT) had a notable move yesterday as it broke its downtrend that has been in place since the peak (trough in long-term yields) right as the Fed started cutting rates in September. It finished yesterday right below its 200-DMA, which could act as resistance going forward, but you have to start somewhere!