Brunch Reads – 5/31/26
Welcome to Bespoke Brunch Reads — a linkfest of some of our favorite articles over the past week. The links are mostly market-related, but there are some other interesting subjects covered as well. We hope you enjoy the food for thought as a supplement to the research we provide you during the week.
Greatness in the Garden:
On May 31st, 1879, the first Madison Square Garden officially opened its doors in New York City, marking the humble beginnings of what would become one of the most famous arenas for sports and entertainment globally. The original arena was built on the site of an old railroad station near Madison Square in Manhattan, which is where the venue got its name. Over time, Madison Square Garden evolved through four different versions, with the current arena opening in 1968 above Pennsylvania Station in Midtown Manhattan.
Throughout its history, Madison Square Garden became known as “The World’s Most Famous Arena,” hosting countless historic moments in sports, music, and politics. Athletes such as Muhammad Ali, Michael Jordan, Wayne Gretzky, and artists like Billy Joel, Elton John, The Grateful Dead, and the Rolling Stones have all been on the biggest stage inside MSG.
MSG is also home to the New York Knicks, who have played there since the latest opening in 1968. For decades, Knicks fans have endured long stretches of disappointment and playoff struggles, despite the iconic arena in which they’ve played every home game. However, the New York Knicks are heading to the NBA finals for the first time since 1999 this year. Led by stars Jalen Brunson and Karl-Anthony Towns, the Knicks have their sights set on bringing a title back to New York, a first since 1973.
More than 140 years after its original opening, Madison Square Garden continues to serve as both a symbol of New York City and a centerpiece of American sports and culture.

Labor
Samsung workers set for $400,000 bonus after deal to share AI profits (Financial Times)
Samsung workers approved a profit-sharing agreement that could pay employees in its memory chip division nearly $400,000 each this year as AI-related chip demand drives record profits. The size of the payouts is already creating tension inside the company, with workers in Samsung’s smartphone and consumer electronics businesses receiving far smaller bonuses despite working for the same employer. [Link]
Continue reading our weekly Brunch Reads linkfest by logging in if you’re already a member or signing up for a trial to one of our two membership levels shown below! You can cancel at any time.

The Bespoke Report – 5/29/26 – Tech’s Ten Percent Two-Fer
To read our weekly Bespoke Report newsletter and access everything else Bespoke’s research platform offers, choose one of our three member plans today!
This week’s report covers a market that keeps making history, a big earnings week for retailers, and a fascinating look at how private credit is financing the AI buildout. Give it a read!


Q1 2026 Earnings Conference Call Recaps: Costco (COST)
Bespoke’s Conference Call Recaps use AI to summarize lengthy earnings calls. The commentary below is AI-generated and then edited by Bespoke for quality control. As always, none of these summaries should be construed as recommendations to buy or sell any securities, and investors should do their own research and/or consult with a financial professional before making any investment decisions.
Our latest recap available to Bespoke subscribers covers Costco (COST) Q3 2026 earnings call.
![]()
Costco (COST) is a membership-based warehouse retailer with 928 locations worldwide, selling everything from groceries and electronics to tires and prescription drugs at competitive prices. Rising oil prices due to the conflict in the Middle East sent gas volumes through the roof, with all three fiscal periods setting successive all-time sales records and the final five weeks becoming the five biggest volume weeks in company history. Net sales hit $69.2 billion, up 11.6%, with comps up 9.8%. Excluding gas entirely, comps still grew 6.6%, showing the core business is healthy. Membership fee income rose 10.7% to $1.37 billion, executive memberships grew 9.6%, and more online customers renewed their memberships. On the digital side, AI-driven traffic to Costco’s site tripled in the quarter and posted the highest conversion rate of any traffic source. Kirkland Signature continues to innovate through premium private-label expansion in categories like protein products, apparel, and health supplements, while Costco’s pharmacy business is surging due in part to strong demand for GLP-1 medications such as Wegovy and Ozempic. Inflation is modest but building in nonfoods due to higher resin and memory chip costs. Costco opened down almost 1% after beating revenue expectations but missing on the bottom line…
Continue reading our Conference Call Recap for COST by becoming a Bespoke Institutional subscriber. You can sign up for Bespoke Institutional now and receive a 14-day trial to read our newest Conference Call Recap. To sign up, choose either the monthly or annual checkout link below:
The Encore Performance
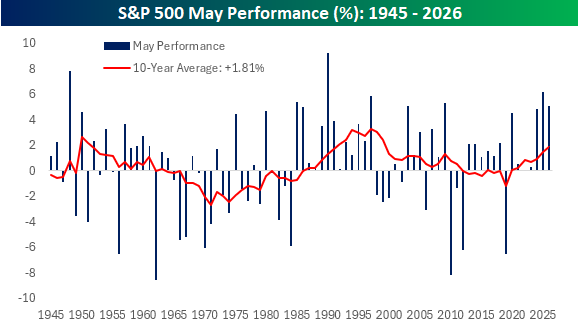
May marks the onset of the “go away” six-month period for US stocks, when they have historically had weaker-than-average returns. In more recent history, though, it has been the encore performance for the October—April period where market returns have historically shined.
With a 5% gain this month, the S&P 500 is on pace for its first-ever “three-peat” of 4%+ gains in May. Not only that, but over the last 14 years, May has only finished in the red once (2019’s -6.58%), driving the 10-year rolling average May return to 1.81%, which is the strongest rolling performance for the month since 1999. Your parents may have once told you that it’s never smart to hang around the bars after last call, but in recent years, staying late has paid off. Now about that hangover the next morning…
Want more from Bespoke? You can start by joining our Think BIG mailing list where you’ll receive an interesting market stat in your inbox a few times per week. All we need is your email address. Join now by clicking here or on the image below.

Q1 2026 Earnings Conference Call Recaps: Dell (DELL)
Bespoke’s Conference Call Recaps use AI to summarize lengthy earnings calls. The commentary below is AI-generated and then edited by Bespoke for quality control. As always, none of these summaries should be construed as recommendations to buy or sell any securities, and investors should do their own research and/or consult with a financial professional before making any investment decisions.
Our latest recap available to Bespoke subscribers covers Dell (DELL) Q1 2027 earnings call.
![]()
Dell (DELL) designs and sells servers, storage, PCs, and networking equipment to businesses of all sizes worldwide. It has become one of the most important picks-and-shovels plays on AI infrastructure, assembling and delivering the physical hardware that hyperscalers, governments, and enterprises need to run the technology. Revenue hit $43.8 billion, up 88%, and EPS grew 214% to $4.86. AI server orders alone were $24.4 billion in a single quarter, and Dell exited with a record $51.3 billion backlog with a pipeline that is multiples larger still. The company raised its full-year revenue guide by $27 billion to a midpoint of $167 billion, with $60 billion expected from AI servers alone. The main constraint is not demand but supply, particularly DRAM, NAND, and CPUs, with lead times stretching to a year on some components. Management also highlighted an emerging trend: new AI systems are increasing demand not only for advanced AI servers but also for traditional CPU-based servers that handle tasks like data processing, storage, and workflow management, creating a market opportunity the company did not expect to see just a few months ago. Storage is recovering strongly with five straight quarters of market outperformance, and the PC business is navigating memory-driven price increases while taking share. Shares of DELL were up over 30% in reaction to its triple play…
Continue reading our Conference Call Recap for DELL by becoming a Bespoke Institutional subscriber. You can sign up for Bespoke Institutional now and receive a 14-day trial to read our newest Conference Call Recap. To sign up, choose either the monthly or annual checkout link below:
Is That It?
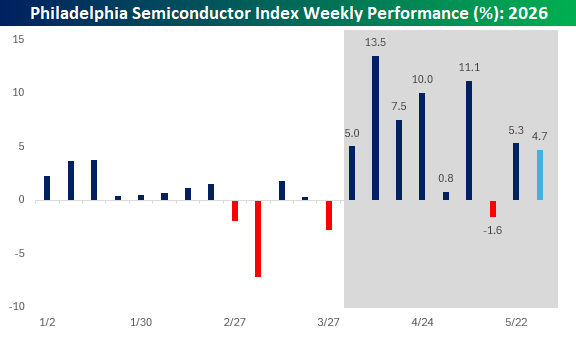
The Philadelphia Semiconductor Index (SOX) is on pace for a gain of just under 5% this week, which by any measure should be considered a great week. Be honest, though, if you hold any of these stocks in your account, have you looked at some of their performances this week and thought to yourself, “Is that it?”
Stocks like Marvell (MRVL), Applied Materials (AMAT), and Taiwan Semi (TSM) are up between 3% and 4% this week, but after gaining anywhere from 40% to 140% YTD, the gains this week seem ho-hum.
A look at weekly SOX performance since the March low illustrates the trend. Yes, the SOX is up 4.7% this week, but relative to recent history, it ranks as the third-worst weekly performance in the last nine. Sure, this week may not look like much compared to the last two months, but the last nine weeks have been a historic run of strength for the sector. As a case in point, if it were any other week before March 30th, it would have been the best week of the year!
After such an incredible run like the last nine weeks for the SOX, it’s easy to get jaded and expect the recent trend to become the norm. It won’t. Just like the Knicks will lose again at some point (hopefully not until next season), the SOX won’t keep going up. Eventually, you’ll look back on this stretch with nostalgia, so soak it in while it lasts, even if it is “only a 4.7%” gain.
Want more from Bespoke? You can start by joining our Think BIG mailing list where you’ll receive an interesting market stat in your inbox a few times per week. All we need is your email address. Join now by clicking here or on the image below.
Bespoke’s Morning Lineup – 5/29/26 – Nine For Nine
See what’s driving market performance around the world in today’s Morning Lineup. Bespoke’s Morning Lineup is the best way to start your trading day. Read it now by starting a two-week trial to Bespoke Premium. CLICK HERE to learn more and start your trial.
“In a crisis, be aware of the danger–but recognize the opportunity.” – John F. Kennedy

Below is a snippet of commentary from today’s Morning Lineup. Start a two-week trial to Bespoke Premium to view the full report.
Futures are modestly higher this morning following a mostly positive session in Asia, where South Korea rallied 3.6% to take its weekly gain to 8%. The Nikkei also rallied 2.5% for a weekly gain of nearly 5%. Asia’s positive moves have flowed through to Europe this morning, and the STOXX 600 is up 0.6%, led higher by Spain, Italy, and France.
Outside of equities, treasury yields and crude oil are modestly lower on reports that the Iran-US ceasefire will be extended, and gold is bouncing after briefly trading below its 200-DMA yesterday.
An AI compute deal between Anthropic, Alphabet (GOOGL), Broadcom (AVGO), Apollo (APO), and Blackstone (BX) was reported on by Bloomberg last night. The deal has a lot of moving parts to it, and raises concerns over complex transactions and whether it’s just a lot of smoke and mirrors. We broke it all down in the commentary section of today’s Morning Lineup and explained why it’s nothing like the transactions that took place leading up to the Financial Crisis, so make sure to check that out.
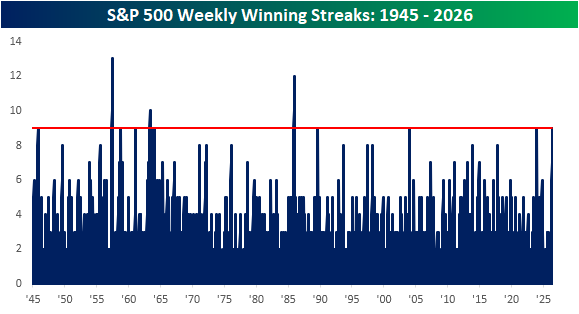
In our experience, we’ve seen enough to know never count anything out, but with the S&P 500 up over 1% already this week, it’s looking likely that the S&P 500 will finish higher this week, extending its weekly streak of gains to nine. The last time the S&P 500 traded higher for nine straight weeks was in December 2023, and the last time there was a longer streak of weekly gains was way back in 1985!
The chart below shows S&P 500 winning streaks in the post-WWII period, and while there have been eleven other nine-week streaks, only four made it to a tenth week or longer. In 1985, the S&P 500 went 12 straight weeks without a decline, and in 1957, the index went 13 weeks, or 3 months, without a weekly decline.
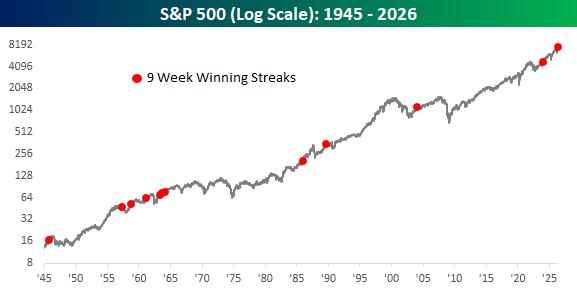
The chart below shows each prior streak on a long-term chart of the S&P 500. Besides the fact that none of these prior periods occurred right near a major top in the market, it’s also interesting to note that they didn’t really occur early on in bull markets coming out of extended bears.
While the S&P 500 keeps chugging along, gold prices have been under pressure for months now, which is a stark contrast to earlier this year when the metal could do no wrong. From the peak in late January, gold prices briefly dropped into bear market territory (on an intraday basis) before rallying intraday. In the process of that decline, gold prices also briefly dipped below the 200-day moving average (DMA) for the first time in 2.5 years.
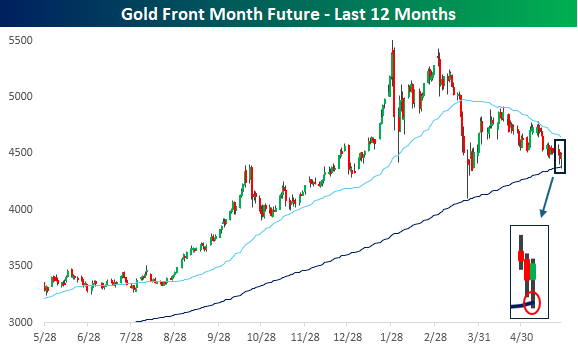
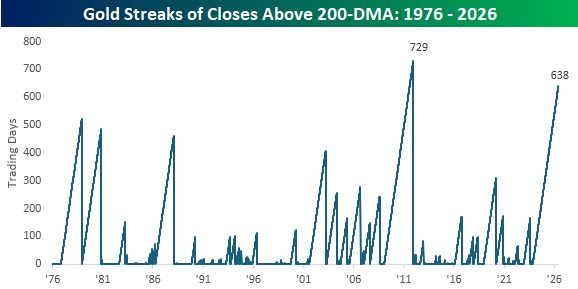
While the streak of trading without a breach of the 200-DMA on an intraday basis ended yesterday, the streak of closes above that level remains intact, and at 638 trading days, it ranks as the second-longest streak on record, trailing only a 729 trading day streak that ended in December 2011. In order for the current streak to break the record, gold would have to stay above its 200-DMA through the summer months and into late October, but it has been an impressive streak.
The decline in gold since its January high, however, should serve as an important reminder that the tide on a trade that can seemingly do no wrong can quickly go out.
Start a two-week trial to Bespoke Premium to continue reading today’s full Morning Lineup.
Q1 2026 Earnings Conference Call Recaps: Dollar Tree (DLTR)
Bespoke’s Conference Call Recaps use AI to summarize lengthy earnings calls. The commentary below is AI-generated and then edited by Bespoke for quality control. As always, none of these summaries should be construed as recommendations to buy or sell any securities, and investors should do their own research and/or consult with a financial professional before making any investment decisions.
Our latest recap available to Bespoke subscribers covers Dollar Tree (DLTR) Q1 2026 earnings call.
![]()
Dollar Tree (DLTR) operates roughly 9,400 discount stores selling everyday essentials, seasonal goods, and discretionary items at low price points, with 85% of its assortment priced at $2 or below. Comps came in at 3.5%, ahead of expectations, and adjusted EPS grew 38% year-over-year to $1.74. The standout story was shrink, which improved for the first time in years thanks to store standards programs. The share of stores operating below internal standards dropped from 42% to under a third in roughly a year. Tariffs were a headwind but were fully offset by operational improvements, and notably, zero tariff refunds were included in the results. The company raised full-year EPS guidance to $6.70 to $7.10, though management was deliberately conservative, absorbing higher fuel costs tied to the Middle East conflict as a full-year headwind rather than flowing Q1 upside through. Traffic is still slightly negative but improving, and management expects it to turn positive in the back half as easier comparisons kick in. DLTR gained 18% on 5/28 after beating EPS and revenue expectations…
Continue reading our Conference Call Recap for DLTR by becoming a Bespoke Institutional subscriber. You can sign up for Bespoke Institutional now and receive a 14-day trial to read our newest Conference Call Recap. To sign up, choose either the monthly or annual checkout link below:
Q1 2026 Earnings Conference Call Recaps: Kohl’s (KSS)
Bespoke’s Conference Call Recaps use AI to summarize lengthy earnings calls. The commentary below is AI-generated and then edited by Bespoke for quality control. As always, none of these summaries should be construed as recommendations to buy or sell any securities, and investors should do their own research and/or consult with a financial professional before making any investment decisions.
Our latest recap available to Bespoke subscribers covers Kohl’s (KSS) Q1 2026 earnings call.
![]()
Kohl’s (KSS) is a mid-tier department store chain with roughly 1,100 locations serving low-to-middle income shoppers across the US. It sells apparel, footwear, home goods, and beauty through its own private labels and national brands, with Sephora shop-in-shops as a key traffic driver. This was the best quarterly comp in four years, down just 1.1%, and management is cautiously optimistic. The clearest win was private label brands, up 6%, driven by juniors’ clothing brand “So” and activewear brand “Flex,” both resonating strongly with value-seeking customers. The Kohl’s card customer, historically the most loyal and productive cohort, went from down mid-single digits in Q4 to flat in Q1, a 600 basis point swing that suggests the turnaround is gaining real traction. Sephora was the one notable disappointment, running down low single digits with weakness in makeup and skincare, though MAC, a cosmetics brand, is rolling out to all stores later this year. Store traffic is still declining, and getting customers back more frequently remains the central challenge. Kohls’s rallied 20% on 5/28 after beating both EPS and revenue expectations…
Continue reading our Conference Call Recap for KSS by becoming a Bespoke Institutional subscriber. You can sign up for Bespoke Institutional now and receive a 14-day trial to read our newest Conference Call Recap. To sign up, choose either the monthly or annual checkout link below:
Q1 2026 Earnings Conference Call Recaps: Salesforce (CRM)
Bespoke’s Conference Call Recaps use AI to summarize lengthy earnings calls. The commentary below is AI-generated and then edited by Bespoke for quality control. As always, none of these summaries should be construed as recommendations to buy or sell any securities, and investors should do their own research and/or consult with a financial professional before making any investment decisions.
Our latest recap available to Bespoke subscribers covers Salesforce’s (CRM) Q1 2027 earnings call.
![]()
Salesforce (CRM) is the world’s largest customer relationship management software company, providing cloud-based tools for sales, customer service, marketing, data analytics, commerce, and workplace collaboration through Slack. Salesforce now processes 28.6 trillion AI tokens quarterly and said Agentforce ARR surpassed $1 billion, highlighting how quickly large enterprises are experimenting with autonomous AI tools. This quarter’s earnings call focused almost entirely on AI monetization and Salesforce’s push to become the “operating system” for enterprise agents. Management repeatedly emphasized that customers are moving beyond pilots into production deployments, with companies like PenFed and UCLA Health using AI agents to reduce call center workloads, automate patient inquiries, and consolidate sprawling software systems. Slack was another major focus, with management calling it the central workspace for both humans and AI agents as Slack AI usage surged 350% quarter-over-quarter. Salesforce also introduced “Headless 360,” allowing AI tools like Claude and ChatGPT to access Salesforce data directly through MCP APIs. After posting better-than-expected EPS and revenue, CRM shares fell 0.75% on 5/28…
Continue reading our Conference Call Recap for CRM by becoming a Bespoke Institutional subscriber. You can sign up for Bespoke Institutional now and receive a 14-day trial to read our newest Conference Call Recap. To sign up, choose either the monthly or annual checkout link below: