The Triple Play Report: 2/24/26
An earnings triple play is a stock that reports earnings and manages to 1) beat analyst EPS estimates, 2) beat analyst sales estimates, and 3) raise forward guidance. You can read more about “triple plays” at Investopedia.com where they’ve given Bespoke credit for popularizing the term. We like triple plays as an indication that a company’s business is firing on all cylinders, with better-than-expected results and an improving outlook. A triple play is indicative of positive “fundamental momentum” instead of pure fundamentals, and there are always plenty of names with both high and low valuations on our quarterly list.
Bespoke’s Triple Play Report covers what each company does, what this quarter’s results say about their growth outlooks, and their histories of delivering triple plays. Bespoke’s Triple Play Report is available at the Bespoke Institutional level only. You can sign up for Bespoke Institutional now and receive a 14-day trial to read today’s Triple Play Report. To sign up, choose either the monthly or annual checkout link below:
Bespoke Institutional – Monthly Payment Plan
Bespoke Institutional – Annual Payment Plan
Bespoke Investment Group, LLC believes all information contained in these reports to be accurate, but we do not guarantee its accuracy. None of the information in these reports or any opinions expressed constitutes a solicitation of the purchase or sale of any securities or commodities. This is not personalized advice. Investors should do their own research and/or work with an investment professional when making portfolio decisions. As always, past performance of any investment is not a guarantee of future results. Bespoke representatives or clients may have positions in securities discussed or mentioned in its published content.
Bespoke’s Morning Lineup – 2/25/26 – Stuck to the 50-DMA
See what’s driving market performance around the world in today’s Morning Lineup. Bespoke’s Morning Lineup is the best way to start your trading day. Read it now by starting a two-week trial to Bespoke Premium. CLICK HERE to learn more and start your trial.
“To devastate is easier and more spectacular than to create.” – Anthony Burgess

Below is a snippet of commentary from today’s Morning Lineup. Start a two-week trial to Bespoke Premium to view the full report.
Equity markets are looking to build on yesterday’s turnaround Tuesday gains and are on pace to erase much of Monday’s losses, but whether these gains stick through the end of the week could depend on Nvidia’s (NVDA) report after the close. It’s widely assumed that the results will be strong, but will they be strong enough? And ff they’re too strong, will that also be interpreted as further future disruption in the software space?
Crude oil is higher this morning, trading just above $66 per barrel, even as Reuters reports that OPEC+ is considering a 137K barrel increase to daily production. Gold is also fractionally higher, back above $5,200 per ounce as silver surges 4% and platinum spikes 8%. Even bitcoin, yes bitcoin, is higher by more than 2%.
Asian stocks finished the day higher across the board, with the Nikkei up over 2% and South Korea up just under 2%. Chinese stocks also traded higher even as the Ministry of Commerce threatened to impose countertrade measures in response to the new tariff policies of the Trump Administration.
In Europe, stocks are also broadly higher but at a more restrained pace. The STOXX 600 is up 0.5%, led higher by 1% gains in Italy and the UK. Eurozone GDP fell more than expected (-0.6% vs -0.5% forecast) and German GDP was in line with expectations, growing 0.3% q/q.
Besides some important earnings reports after the close from NVDA and Salesforce (CRM), it’s a quiet day for data, but we will hear from many Fed speakers, including Barkin, Schmid, and Musalem.
Given the ongoing weakness we have seen in certain areas of the market, which investors now think will be devastated by AI, it’s still hard to believe how range-bound the S&P 500 has been. Yesterday, the S&P 500 closed less than 0.1% below its 50-day moving average. You can’t get much closer than that! And it wasn’t just yesterday. The rangebound morass has been going on for months now, as there hasn’t been a day in the last three months where the S&P 500 closed more than 2.5% above or below its 50-day moving average.
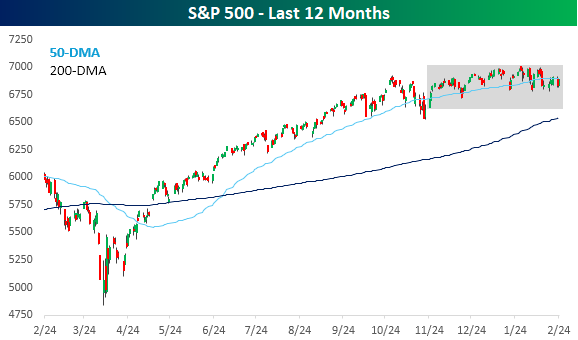
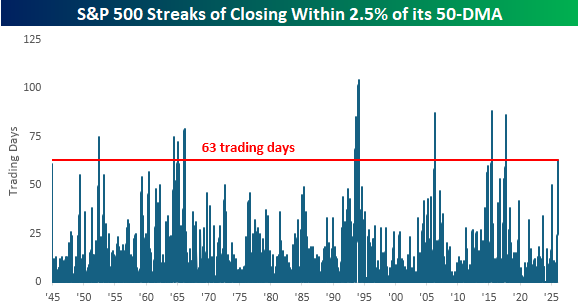
Periods where the S&P 500 has been so closely anchored to its 50-DMA haven’t been all that common throughout history. The chart below shows streaks when the S&P 500 closed within 2.5% of its 50-DMA (above or below), and the current streak, which reached three months (63 trading days) yesterday, is the longest since the first Trump administration in August 2017. Since WWII, there haven’t been many other extended periods where price was consistently so close to its 50-DMA.
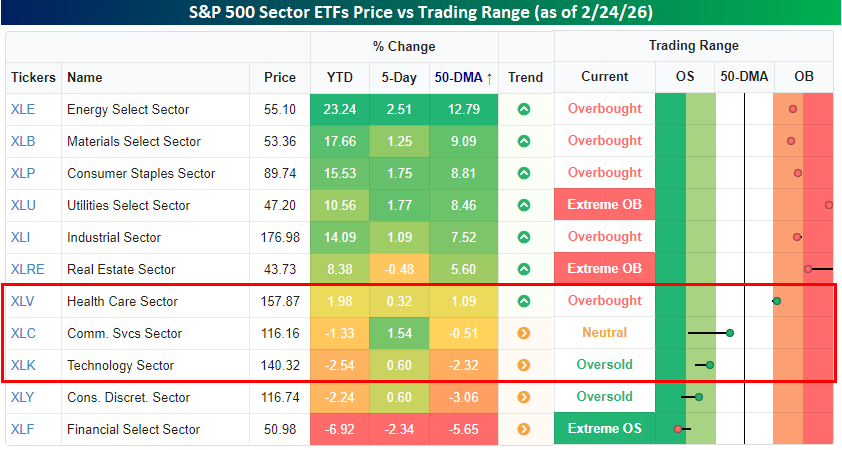
What makes the current streak even more incredible is that most sectors haven’t been showing the same pattern. As of yesterday’s close, just three of eleven S&P 500 sector ETFs – Health Care (XLV), Communication Services (XLC), and Technology (XLK) – closed within 2.5% of their 50-DMAs, and most sectors aren’t even close. Six are more than 5% above their 50-DMAs, and another is more than 5% below its 50-DMA. Like a sleeping volcano, the S&P 500 looks placid from above, but underground, the molten lava bubbles.
The Closer – AI Doom, ADP, Earnings – 2/24/26
Log-in here if you’re a member with access to the Closer.
Looking for deeper insight into markets? In tonight’s Closer sent to Bespoke Institutional clients, we kick off with a review of the latest Fedspeak in addition to all the further pain in software names (pages 1 – 3). Next up, we show where some outperformers were today in addition to an update on regional Fed indices (page 4). After that, we provide a review of the latest positioning data (pages 5 & 6).
See today’s full post-market Closer and everything else Bespoke publishes by starting a 14-day trial to Bespoke Institutional today!
The Triple Play Report: 2/23/26
An earnings triple play is a stock that reports earnings and manages to 1) beat analyst EPS estimates, 2) beat analyst sales estimates, and 3) raise forward guidance. You can read more about “triple plays” at Investopedia.com where they’ve given Bespoke credit for popularizing the term. We like triple plays as an indication that a company’s business is firing on all cylinders, with better-than-expected results and an improving outlook. A triple play is indicative of positive “fundamental momentum” instead of pure fundamentals, and there are always plenty of names with both high and low valuations on our quarterly list.
Bespoke’s Triple Play Report covers what each company does, what this quarter’s results say about their growth outlooks, and their histories of delivering triple plays. Bespoke’s Triple Play Report is available at the Bespoke Institutional level only. You can sign up for Bespoke Institutional now and receive a 14-day trial to read today’s Triple Play Report. To sign up, choose either the monthly or annual checkout link below:
Bespoke Institutional – Monthly Payment Plan
Bespoke Institutional – Annual Payment Plan
Bespoke Investment Group, LLC believes all information contained in these reports to be accurate, but we do not guarantee its accuracy. None of the information in these reports or any opinions expressed constitutes a solicitation of the purchase or sale of any securities or commodities. This is not personalized advice. Investors should do their own research and/or work with an investment professional when making portfolio decisions. As always, past performance of any investment is not a guarantee of future results. Bespoke representatives or clients may have positions in securities discussed or mentioned in its published content.
Q4 2025 Earnings Conference Call Recaps: Domino’s Pizza (DPZ)
Bespoke’s Conference Call Recaps use AI to summarize lengthy earnings calls. The commentary below is AI-generated and then edited by Bespoke for quality control. As always, none of these summaries should be construed as recommendations to buy or sell any securities, and investors should do their own research and/or consult with a financial professional before making any investment decisions.
Our latest recap available to Bespoke subscribers covers Domino’s Pizza’s (DPZ) Q4 2025 earnings call.
![]()
Domino’s Pizza (DPZ) is the world’s largest pizza company by retail sales, operating over 21,000 stores globally through a franchise-heavy model with roughly 7,186 US locations. As the dominant player in quick-serve (QSR) pizza with approximately 25% US market share, the company offers insight into consumer spending patterns across income cohorts, the evolving economics of delivery versus carryout, and the competitive dynamics of value-driven restaurant businesses. Management guided to 3% US same-store sales growth in 2026 against what they expect will remain a pressured macro backdrop. CEO Weiner introduced the ambition of doubling US retail sales from roughly $10 billion over time, benchmarking against QSR category leaders with 40-50% share. Pricing was flat in Q4, yet estimated franchisee store profitability grew to approximately $166,000, management’s “profit power” thesis in action. The company grew all income cohorts in 2025, pushing back on the lower-income consumer weakness narrative prevalent across QSR. On aggregators, management stressed they haven’t reached fair share on Uber or DoorDash and are growing those platforms carefully to ensure new orders are genuinely additional rather than cannibalizing their own direct channels. DPZ reported better-than-expected revenue on weaker EPS, as the stock climbed 4.1% on 2/23…
Continue reading our Conference Call Recap for DPZ by becoming a Bespoke Institutional subscriber. You can sign up for Bespoke Institutional now and receive a 14-day trial to read our newest Conference Call Recap. To sign up, choose either the monthly or annual checkout link below:
Q4 2025 Earnings Conference Call Recaps: Home Depot (HD)
Bespoke’s Conference Call Recaps use AI to summarize lengthy earnings calls. The commentary below is AI-generated and then edited by Bespoke for quality control. As always, none of these summaries should be construed as recommendations to buy or sell any securities, and investors should do their own research and/or consult with a financial professional before making any investment decisions.
Our latest recap available to Bespoke subscribers covers Home Depot’s (HD) Q4 2025 earnings call.

Home Depot (HD) is the world’s largest home improvement retailer, operating 2,359 stores across the US, Canada, and Mexico, with $164.7 billion in fiscal 2025 sales. The company serves both Do-It-Yourself consumers and professional contractors, and its recent acquisitions of specialty distributors SRS and GMS have expanded its reach into roofing, building materials, and the professional trades. Management described a year of stable but subdued demand, with full-year comps up just 0.3% as housing turnover remains near 30-to-40-year lows and large discretionary projects stay pressured. CEO Ted Decker called big-ticket discretionary recovery the “telltale” for a market turn, one they have not yet seen. On tariffs, the team said pricing actions on mid-single-digit exposure are largely complete, translating to roughly 3% SKU-level price increases. SRS gained roofing market share despite industry shingle shipments falling 28% in Q4 to their lowest level since 2019, though aggressive pricing will weigh on Q1 margins. Fiscal 2026 guidance calls for flat-to-2% comps, with EPS growth of flat-to-4%. On better-than-expected results, HD shares opened 3.3% higher on 2/24…
Continue reading our Conference Call Recap for HD by becoming a Bespoke Institutional subscriber. You can sign up for Bespoke Institutional now and receive a 14-day trial to read our newest Conference Call Recap. To sign up, choose either the monthly or annual checkout link below:
Industry Group Rotation Since the Last Market High
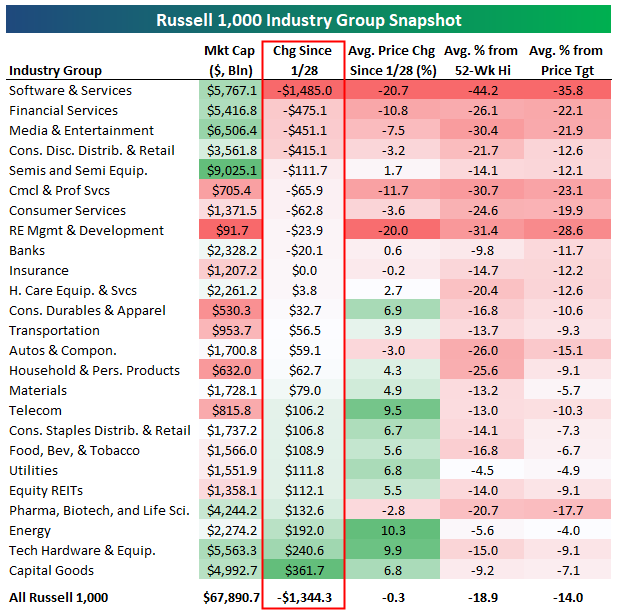
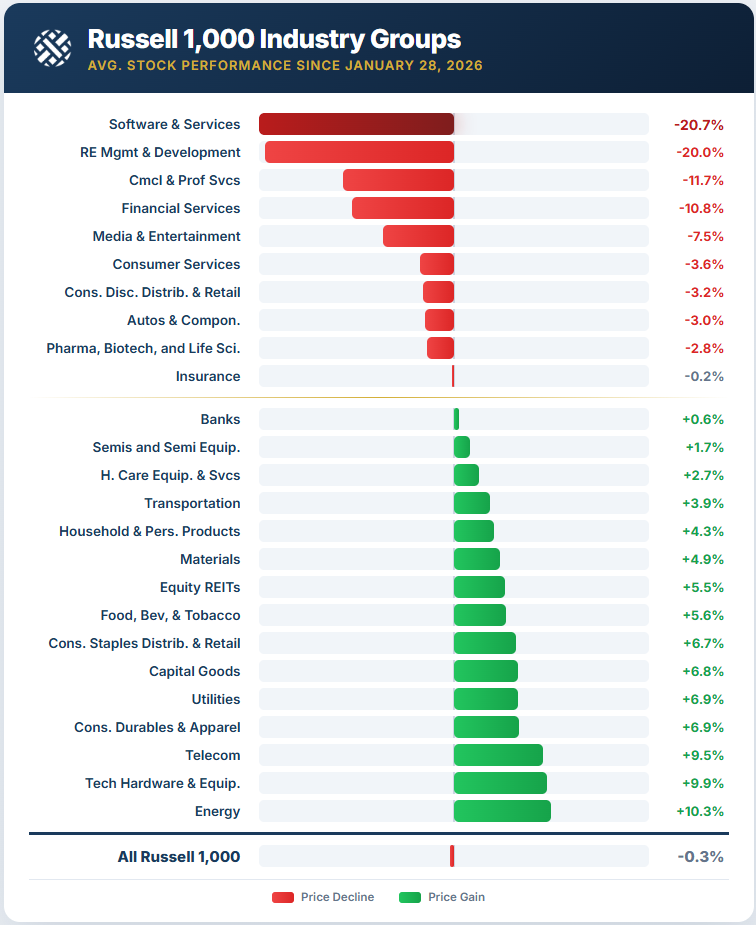
Large-cap US equity indices made their last all-time highs at the end of January on 1/28, which was also the last Fed Day. As of 2/23, the S&P 500 was down about 2% since 1/28, while the mega-cap heavy Nasdaq 100 was down 5%.
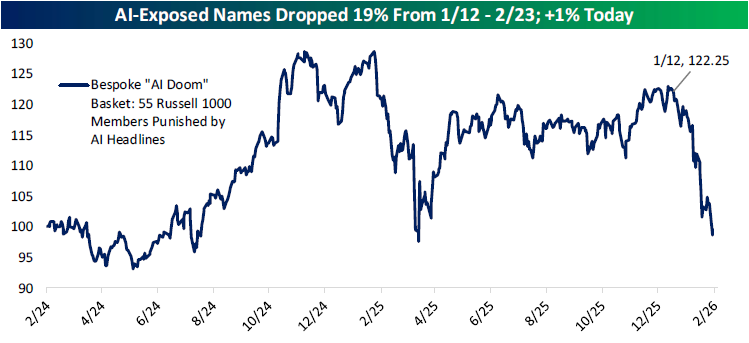
Within the broader large-cap Russell 1,000 (R1K), the average stock in the index is down just 0.3% since 1/28. But we’ve seen the market lose about $1.34 trillion in market cap over this time frame. Most of that can be chalked up to the “AI Doom” trade, where groups like Software & Services and Financial Services have been pummeled because of the threat that AI will make them obsolete.
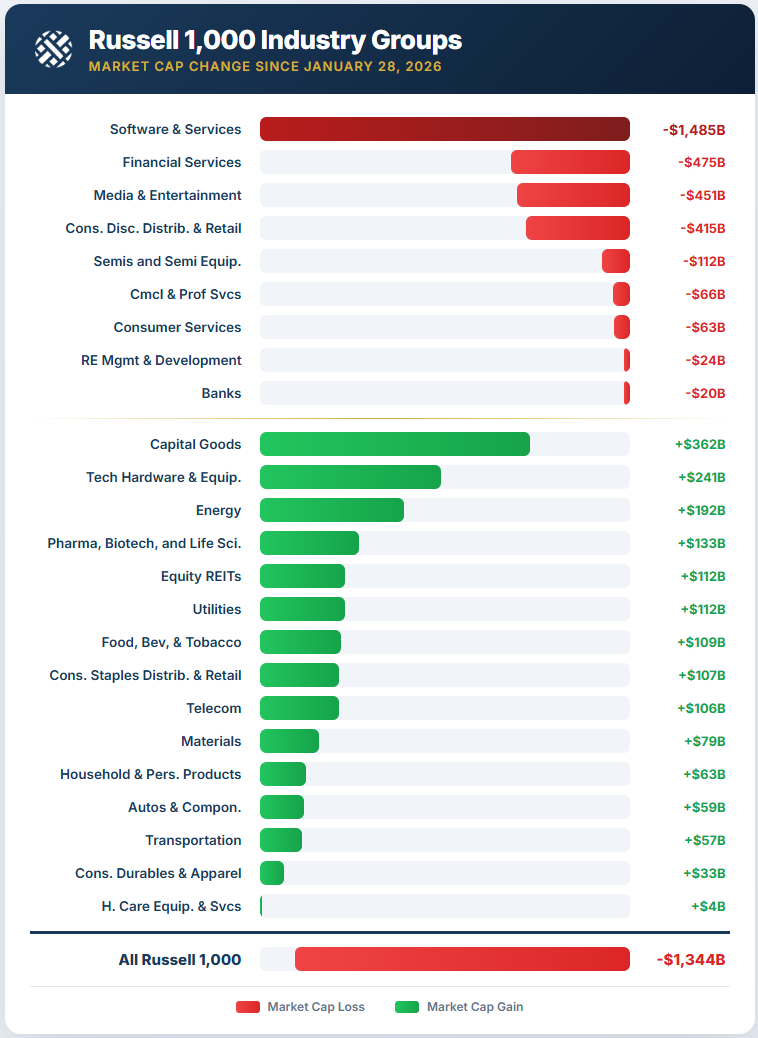
As shown below, Software has seen its market cap fall by nearly $1.5 trillion since 1/28, while Financial Services has fallen nearly $500 billion. Media & Entertainment has also seen a $451 billion drop, followed by Consumer Discretionary Distribution & Retail with a decline of $415 billion.
Combined, these four groups have lost about $2.8 trillion in value.
Below are a series of graphics highlighting recent industry group performance.
Some of the groups that have seen the biggest gains in market cap over the same time frame include Capital Goods, Tech Hardware, Energy, and Pharma/Biotech.
Below is a look at the average stock’s percentage change since 1/28 by industry group. Software and Real Estate Management & Development stocks have easily seen the biggest drops at -20%+.
Nine groups have averaged gains of more than 5%, however.
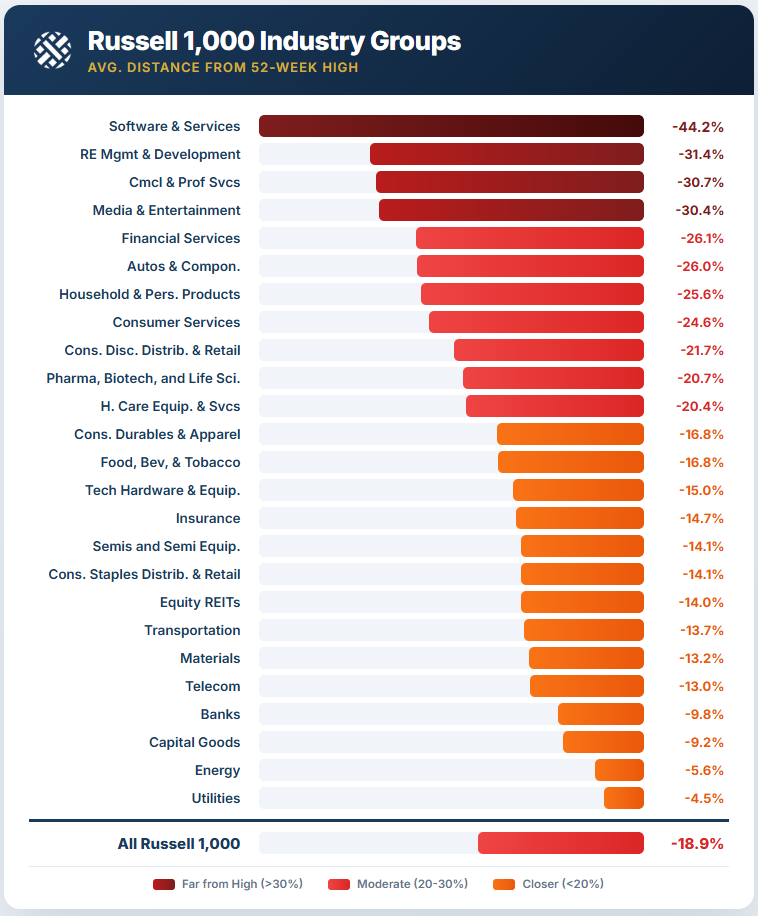
The average Russell 1,000 stock is currently about 19% below its 52-week high. Four groups are at -30%: Software, Real Estate Management & Development, Commercial & Professional Services, and Media & Entertainment. On the flip side, the average Utilities stock is less than 5% from its 52-week high.
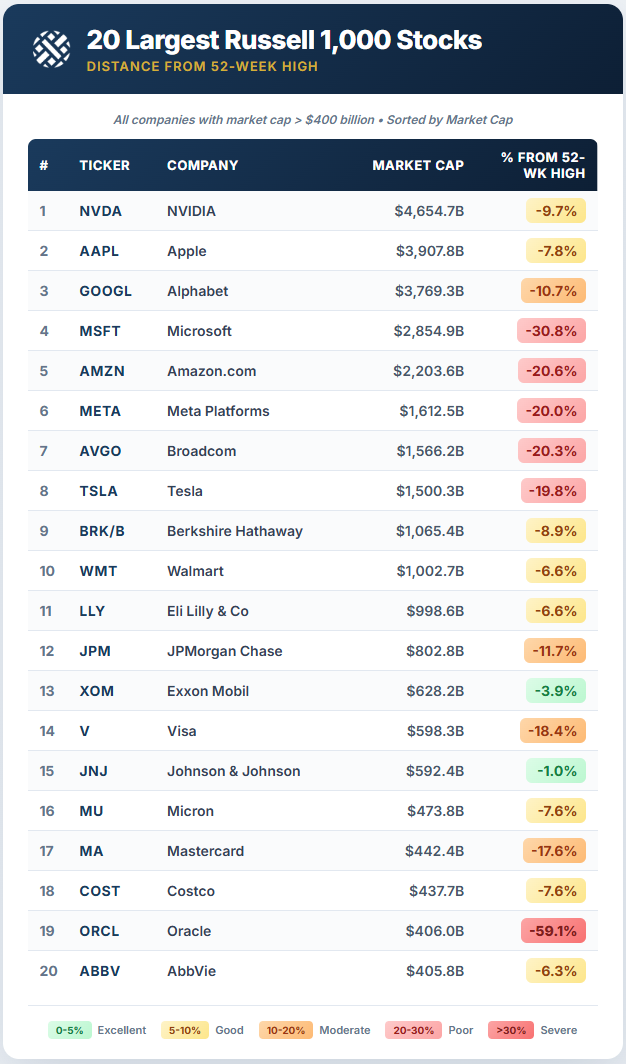
If you’re interested, below is a look at the twenty largest stocks in the Russell 1,000, along with each one’s current distance fromits 52-week high. Of the $1+ trillion companies, Microsoft (MSFT) is in the biggest drawdown at -30.8%, followed by Amazon (AMZN), Meta (META), Broadcom (AVGO), and Tesla (TSLA) – all around -20%. Oracle (ORCL) is the farthest from 52-week highs of the names listed at -59%, while Johnson & Johnson (JNJ) is the closest at just -1%.

Bespoke’s Morning Lineup – 2/24/26 – Worst Snow Day Ever
See what’s driving market performance around the world in today’s Morning Lineup. Bespoke’s Morning Lineup is the best way to start your trading day. Read it now by starting a two-week trial to Bespoke Premium. CLICK HERE to learn more and start your trial.
“I don’t know what happened. It was just euphoria. I can’t even explain what I was feeling, just pure joy.” – Charlie McAvoy
Below is a snippet of commentary from today’s Morning Lineup. Start a two-week trial to Bespoke Premium to view the full report.
After trading uniformly higher earlier, equity futures are mixed this morning, with the S&P 500 fractionally lower, while the Nasdaq is higher. Investors are still reeling from yesterday’s tech sell-off, as markets start to think that AI-disruption will negatively impact just about every business and sector. Treasury yields are little changed, but at 4.03%, the 10-year yield is near the low end of its range. Crude oil is modestly higher but still hovering around $66 per barrel, while gold is down over 1% and Bitcoin is down another 2% and barely hanging on to $63,000.
In Asia, Japan, South Korea, and China were all firmly higher as the latter returned from the Lunar New Year holiday, while India and Hong Kong were both down over 1%. In Europe, trading has been directionless in early trading with the STOXX up 0.2%, but at the country level, performance has varied between gains and losses.
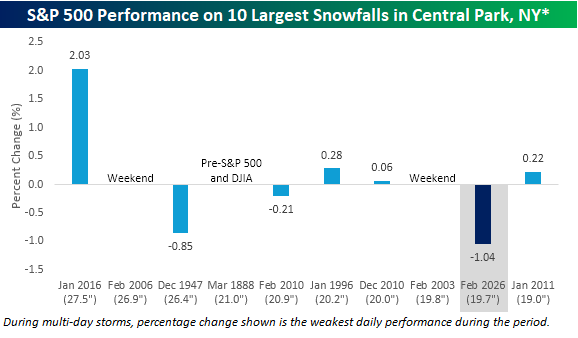
Let’s start with yesterday’s blizzard in the Northeast. With 19.7 inches of snow in New York’s Central Park, it was the ninth-largest snowfall in New York City history. While travel bans were in place around the New York tri-state area, the bears had no trouble getting to work. With the S&P 500 down 1.04%, it was the worst single-day performance for the S&P 500 during one of its ten-largest snowstorms on record. As shown in the chart below, during the prior top ten snowstorms for New York City, the weakest single-day performance during one of these snowstorms was a decline of 0.85% on 12/26/1947.
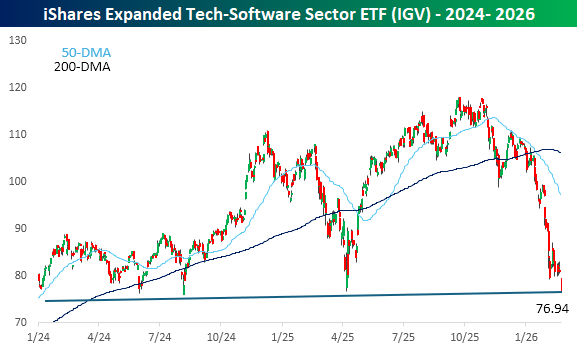
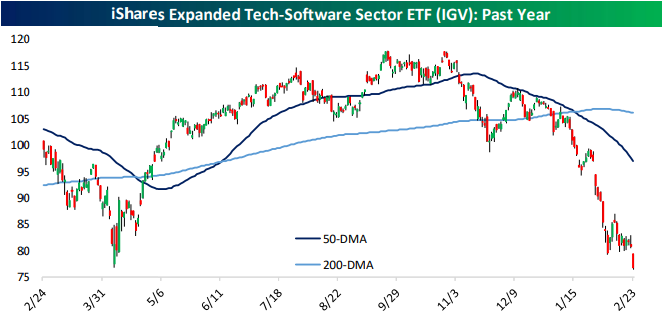
As it has been for some time, the software sector was responsible for much of yesterday’s weakness. The iShares Expanded Tech-Software Sector ETF (IGV) fell close to 5% and to its lowest level on an intraday basis since August 2024 as the lows from earlier this month broke like a hot knife through butter.
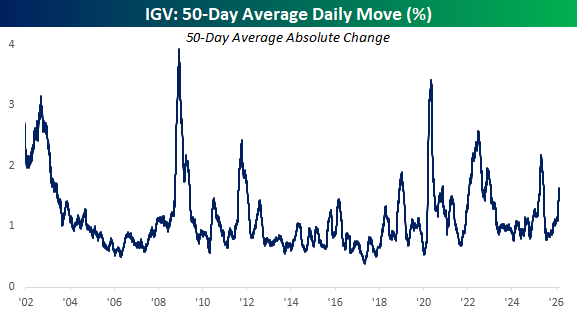
While software has been weak, it hasn’t necessarily been as volatile as you would expect. Over the last 50 trading days, IGV’s average daily change has been a gain or loss of 1.6%. While that’s elevated, it’s hardly anywhere near a historical extreme. Even in early 2025, the average daily change was much higher at over 2%.
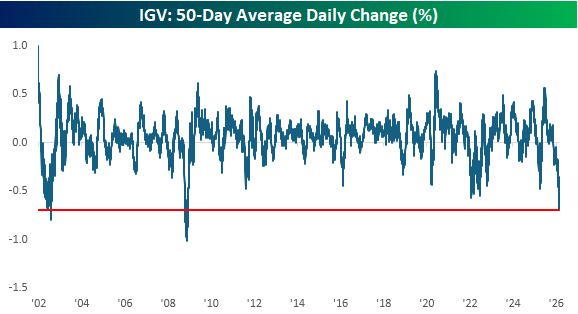
Where the moves in IGV have been extreme, though, is in terms of the average daily percentage change (not the absolute daily change but the average of the trailing 50-day changes). As of yesterday’s close, IGV’s average daily change was a decline of 0.69%, which ranks as one of the most negative readings in the ETF’s history. In fact, the only times that IGV was more of a one-way trade to the downside were during the Financial Crisis and at the end of the dot-com bust.
The Closer – Fedspeak, Software, Scarcity – 2/23/26
Log-in here if you’re a member with access to the Closer.
Looking for deeper insight into markets? In tonight’s Closer sent to Bespoke Institutional clients, we kick off with a review of the latest Fedspeak in addition to all the further pain in software names (pages 1 – 3). Next up, we show where some outperformers were today in addition to an update on regional Fed indices (page 4). After that, we provide a review of the latest positioning data (pages 5 & 6).
See today’s full post-market Closer and everything else Bespoke publishes by starting a 14-day trial to Bespoke Institutional today!
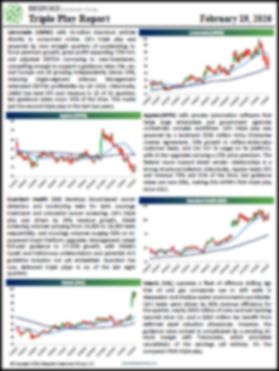
The Triple Play Report: 2/19/26
An earnings triple play is a stock that reports earnings and manages to 1) beat analyst EPS estimates, 2) beat analyst sales estimates, and 3) raise forward guidance. You can read more about “triple plays” at Investopedia.com where they’ve given Bespoke credit for popularizing the term. We like triple plays as an indication that a company’s business is firing on all cylinders, with better-than-expected results and an improving outlook. A triple play is indicative of positive “fundamental momentum” instead of pure fundamentals, and there are always plenty of names with both high and low valuations on our quarterly list.
Bespoke’s Triple Play Report covers what each company does, what this quarter’s results say about their growth outlooks, and their histories of delivering triple plays. Bespoke’s Triple Play Report is available at the Bespoke Institutional level only. You can sign up for Bespoke Institutional now and receive a 14-day trial to read today’s Triple Play Report. To sign up, choose either the monthly or annual checkout link below:
Bespoke Institutional – Monthly Payment Plan
Bespoke Institutional – Annual Payment Plan
Bespoke Investment Group, LLC believes all information contained in these reports to be accurate, but we do not guarantee its accuracy. None of the information in these reports or any opinions expressed constitutes a solicitation of the purchase or sale of any securities or commodities. This is not personalized advice. Investors should do their own research and/or work with an investment professional when making portfolio decisions. As always, past performance of any investment is not a guarantee of future results. Bespoke representatives or clients may have positions in securities discussed or mentioned in its published content.