Who are you, and what did you do with Nvidia (NVDA)?
“Who are you, and what did you do with Nvidia (NVDA)?”
Nvidia (NVDA) is the largest company in the world, which also makes it the largest semiconductor company. Therefore, you would think that what’s good for the stock is good for the Philadelphia Semiconductor Index (SOX) and vice versa. Most of the time, that’s the case, but over the last month, we’ve seen the opposite play out, prompting the question above.
Over the last 21 trading days, the daily moves of NVDA and the SOX have been in opposite directions ten times (48%). Just last week, the divergence was even wider, with the two moving conversely on 12 of 21 trading days (57%).
Since this bull market started in October 2022, the two have never moved in opposite directions more frequently than they have in recent weeks. The only other periods where daily divergences occurred with nearly as much frequency were in December 2023, July 2024, and December 2025.
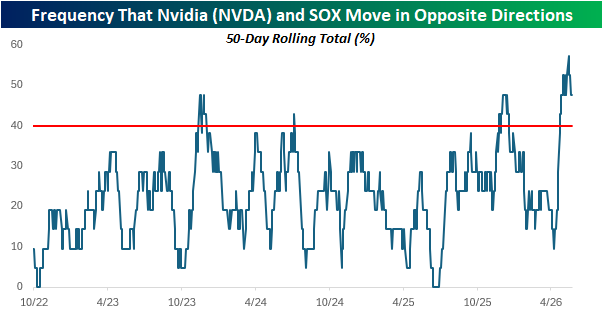
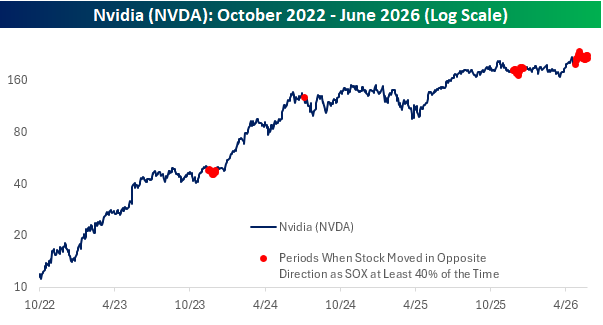
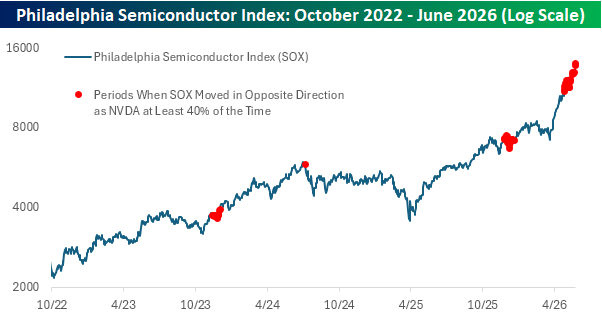
We were curious to see if prior periods of such high-frequency divergence signaled a trend moving forward. In the charts below, we show the performance of NVDA and the SOX since the start of the bull market, with red dots highlighting every time the 21-day frequency of daily divergences exceeded 40%.
For both NVDA and the SOX, forward returns following these periods were all over the map, featuring gains, losses, and sideways trading alike. Therefore, as tempting as it may be to read the recent divergence as a canary in the coal mine for NVDA or the semiconductor space, it’s probably nothing more than a short-term quirk.
With the July 4th holiday coming up, make sure to pick up one (or two or three) of our fun t-shirts or sweatshirts to wear for the 250th. You can find them at Bespoke Threads or an even wider selection at our Task Force 250 store.

Bespoke’s Morning Lineup – 6/3/26 – Streaks Everywhere You Look
See what’s driving market performance around the world in today’s Morning Lineup. Bespoke’s Morning Lineup is the best way to start your trading day. Read it now by starting a two-week trial to Bespoke Premium. CLICK HERE to learn more and start your trial.
“I never learned anything while i was talking.” – Larry King

Below is a snippet of commentary from today’s Morning Lineup. Start a two-week trial to Bespoke Premium to view the full report.
We’ve seen a mixed picture in equity futures this morning, with the S&P 500 indicated to open less than 10 bps lower while the Nasdaq looks to open 0.2% higher as strength in tech stocks continues to drive the market higher. Treasury yields are slightly higher, with the 10-year up 2 bps to 4.48% while the 30-year yield once again flirts with 5%. Oil prices are 2% higher as the US and Iran traded military strikes overnight, threatening to upend any hopes for a resolution in the war. Gold prices are down almost 1% while Bitcoin is basically unchanged.
Asian markets were mixed again overnight. The Nikkei surged 2.5% to a record high, fueled by technology stocks. Stocks in Hong Kong moved in the opposite direction, falling 1.6%, while China was up slightly and South Korea was closed for a holiday. Service sector PMI indices for May were released and generally were in line with or better than expected.
European stocks have been moving in more unison this morning, and the direction is lower. The STOXX 600 is down 0.5% with a 1.1% decline in Germany leading the way lower, while Spain bucks the negative tide with a rally of 0.3%. The weakness comes despite stronger-than-expected PMIs for the services sector, as renewed tensions between the US and Iran and new proposed tariffs from the US take on a greater significance.
In the US this morning, we’ll also get updated PMI readings for the Services sector along with Factory Orders and Durable Goods, but all that will come after the 8:15 release of the ADP Employment report, which just hit the tapes and came in stronger than expected at 122K versus forecasts for an increase of 120K.
There’s been some incredible streaks unfolding over the last several weeks. Heading into the start of tomorrow’s Memorial Tournament, the world’s number one golfer, Scottie Scheffler, had finished within the top 25 of all 11 tournaments he played in this season, extending his streak dating back to August 2024 to 32. In the modern era (since 1983), Tiger Woods holds the title for most consecutive top 25 finishes with 38 in a streak that stretched from the 1999 Buick Invitational to the 2001 Phoenix Open.
In the NBA, the New York Knicks have won 11 straight playoff games heading into the start of today’s NBA Finals. The only two other teams to win more straight playoff games in a single postseason were the Golden State Warriors (15) in 2017 and the San Antonio Spurs (12) in 1999. Both teams ultimately won the championship, with the Warriors beating the Cavaliers in five games and the Spurs beating the Knicks in 5.
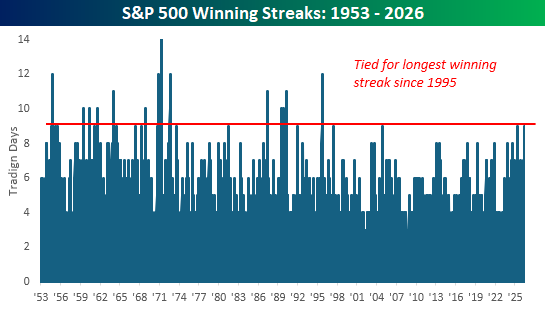
Within the market, we’ve also seen some incredible streaks. In Monday’s Chart of the Day, we highlighted the back-to-back monthly gains of more than 5%, and then on Tuesday, we provided an analysis of the S&P 500’s streak of 21 straight days of closing more than 5% above its 50-DMA. Some other notable streaks worth noting involve the number nine. Heading into this week, the S&P 500 was up for nine straight weeks, and yesterday, the index closed higher for the 9th day in a row!
The chart below shows prior daily winning streaks for the S&P 500, and with yesterday’s gain, the current streak ranks as tied for the longest since 1995. That streak in 1995 lasted 12 trading days and was tied for the second-longest since at least late 1952, when the five-trading-day workweek in its current form started. The longest streak on record was 14 days ending in April 1971.
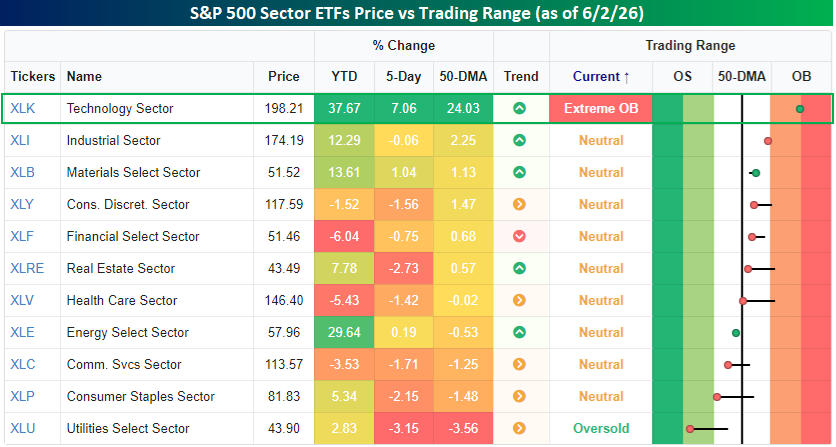
We’ve extensively covered the Technology sector’s outperformance since the March lows. Heading into today’s trading, it’s clearly been a tech and everyone else market. As shown in the snapshot below from our Trend Analyzer, Technology is the only sector trading in “extreme” overbought territory, let alone merely even overbought territory. Further, in the last five trading days, the sector is up over 7%, outperforming the next closest sector by more than seven full-percentage points! Tech doesn’t necessarily have to go down from here, but it’s highly unlikely to keep up this degree of outperformance in the near term.
Start a two-week trial to Bespoke Premium to continue reading today’s full Morning Lineup.
The Closer – AI Credit, Exchange Pain, JOLTS – 6/2/26
Log-in here if you’re a member with access to the Closer.
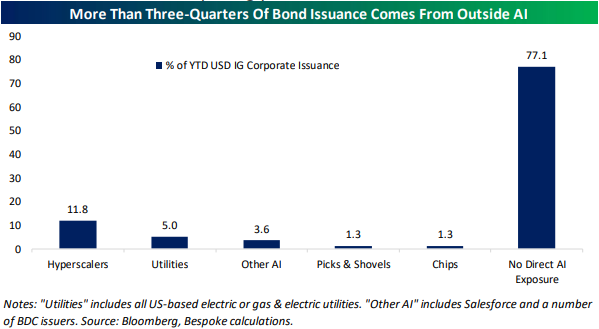
- Credit issuance was extremely strong in May as US corporate bond issuance topped $1trn YTD.
- On news that the CFTC would allow 24/7 financial product trading including crypto perpetual futures, CBOE (CBOE) has fallen 25% in the past ten sessions.
- Private job openings are now the highest since March 2024, and while this series can be a bit volatile, the local trend has started to move slightly higher.
See today’s full post-market Closer and everything else Bespoke publishes by starting a 14-day trial to Bespoke Institutional today!
The Triple Play Report: 6/2/26
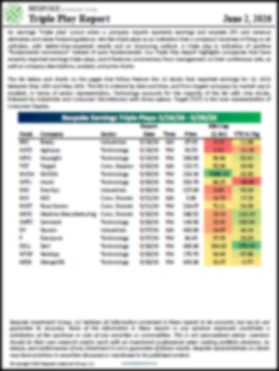
An earnings triple play is a stock that reports earnings and manages to 1) beat analyst EPS estimates, 2) beat analyst sales estimates, and 3) raise forward guidance. You can read more about “triple plays” at Investopedia.com where they’ve given Bespoke credit for popularizing the term. We like triple plays as an indication that a company’s business is firing on all cylinders, with better-than-expected results and an improving outlook. A triple play is indicative of positive “fundamental momentum” instead of pure fundamentals, and there are always plenty of names with both high and low valuations on our quarterly list.
Bespoke’s Triple Play Report covers what each company does, what this quarter’s results say about their growth outlooks, and their histories of delivering triple plays. Bespoke’s Triple Play Report is available at the Bespoke Institutional level only. You can sign up for Bespoke Institutional now and receive a 14-day trial to read today’s Triple Play Report. To sign up, choose either the monthly or annual checkout link below:
Bespoke Institutional – Monthly Payment Plan
Bespoke Institutional – Annual Payment Plan
Bespoke Investment Group, LLC believes all information contained in these reports to be accurate, but we do not guarantee its accuracy. None of the information in these reports or any opinions expressed constitutes a solicitation of the purchase or sale of any securities or commodities. This is not personalized advice. Investors should do their own research and/or work with an investment professional when making portfolio decisions. As always, past performance of any investment is not a guarantee of future results. Bespoke representatives or clients may have positions in securities discussed or mentioned in its published content.
Bespoke’s Morning Lineup – 6/2/26 – Software: Grabbing the Baton or Flash in the Pan?
See what’s driving market performance around the world in today’s Morning Lineup. Bespoke’s Morning Lineup is the best way to start your trading day. Read it now by starting a two-week trial to Bespoke Premium. CLICK HERE to learn more and start your trial.
“Though a good deal is too strange to be believed, nothing is too strange to have happened.” – Thomas Hardy
Below is a snippet of commentary from today’s Morning Lineup. Start a two-week trial to Bespoke Premium to view the full report.
While Dow futures point to a 0.45% decline at the open, futures on the S&P 500 and Nasdaq are down much less, indicating a decline of less than 0.2%…for now. Crude oil is down 1.5% but still above $90 per barrel, while the 10-year yield declines 5 bps to 4.43%. Gold prices are up over 1% while Bitcoin is down over 3% and back below $70 as traders increasingly lose patience with the crypto space in search of greener pastures.
It’s a quiet day for economic data today, with the 10 AM JOLTS being the only report on the calendar. We’ll also get May vehicle sales data from the major OEMs throughout the day.
Overnight in Asia, it was a mixed session with the Nikkei down 0.3% while Hong Kong and China both rallied. South Korea’s KOSPI experienced a marginal gain of 0.2%, which, relative to recent moves, seems like a decline!
In Europe, the tone is more positive as the STOXX 600 rallies 0.7%, led higher by Italy and Germany. May CPI for the Eurozone increased 3.2% y/y, which was right in line with expectations, while Core CPI was slightly ahead of consensus forecasts (2.5% vs 2.4%).
Since the market low at the end of March, the S&P 500 is up just under 20%, but as we are all aware, breadth has been narrow. The lion’s share of the gains has been in the Technology sector, which has rallied over 45%, and the only other sector outperforming the S&P 500 over that time is Communications Services, which is ahead of the index only just barely. The nine other sectors in the S&P 500 are all underperforming the index by a wide margin, including three – Energy, Utilities, and Consumer Staples – which are lower.
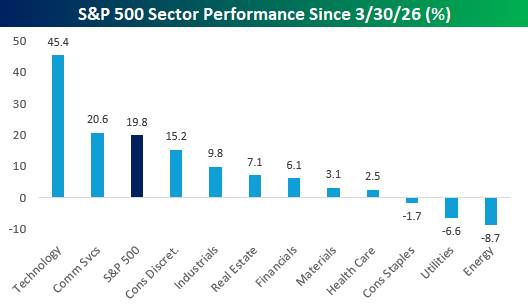
One way to illustrate the dominance of tech since the March low is in the performance of each S&P 500 component. Since the March 30 low, 38 of the top 50 performing stocks are from the Technology sector, including 23 of the top 25 and all of the top 13. It’s been Technology and everyone else.
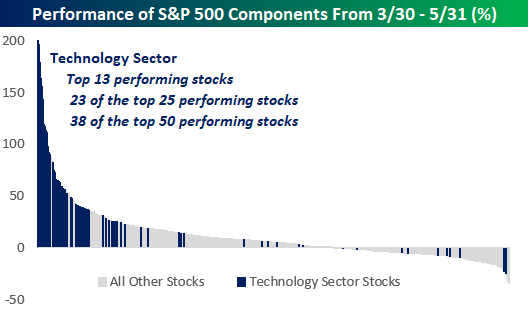
Of the top performing stocks since 3/30, the tech stocks dominating the list have primarily been – you guessed it – semiconductor stocks, and more specifically memory stocks. Many of these names doubled or tripled in the span of just two months!
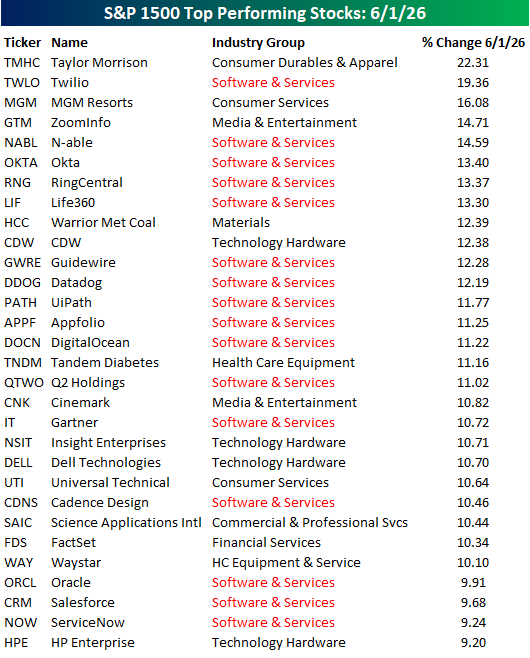
In yesterday’s trading, Technology was once again the top performing sector in the S&P 500 and one of just two sectors to trade higher. In looking at the top performing stocks yesterday, Technology stocks once again dominated the list, but it wasn’t semis. In fact, of the top 30 performing stocks in the S&P 1500 yesterday, not a single semiconductor stock made the list even though Technology was one of only two sectors to trade higher.
As shown in the list below, yesterday’s dominant group within the Technology sector was software stocks. Of the 30 top performing stocks, more than half were from the Software and Services Industry Group.
Start a two-week trial to Bespoke Premium to continue reading today’s full Morning Lineup.
The Closer – Crude Skew, Software Surge, AI Capital Raise – 6/1/26
Log-in here if you’re a member with access to the Closer.
- While bond yields finished well off season highs, the 2s30s curve is near its flattest levels of the past year while forward inflation pricing is falling despite higher oil prices.
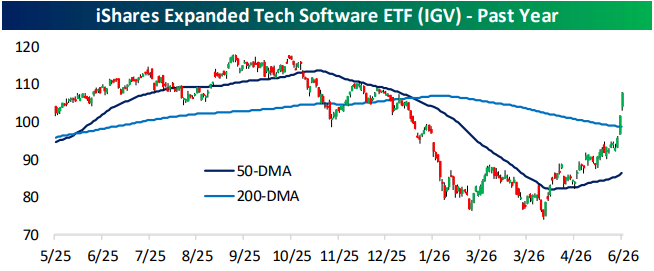
- After back-to-back gains of over 5% on Friday and today, software (IGV) has taken out its 200-DMA and moved into extreme overbought territory.
- Anthropic has filed its draft S-1 confidentially ahead of an IPO and Alphabet (GOOGL) announced it would raise $80 bn in new equity capital.
See today’s full post-market Closer and everything else Bespoke publishes by starting a 14-day trial to Bespoke Institutional today!
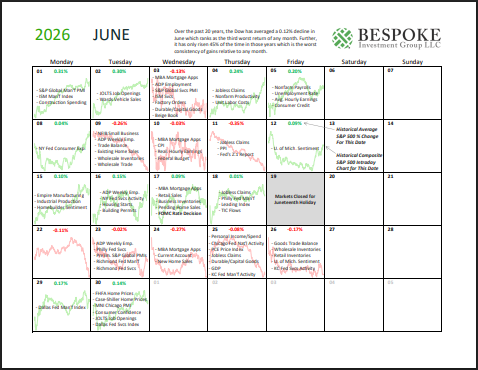
Bespoke Market Calendar — June 2026
Please click the image below to view our June 2026 market calendar. This calendar includes the S&P 500’s historical average percentage change and average intraday chart pattern for each trading day during the upcoming month. It also includes market holidays and options expiration dates plus the dates of key economic indicator releases.Click here to view Bespoke’s premium membership options.
Matrix of Economic Indicators – 6/1/26
Our Matrix of Economic Indicators provides a concise summary analysis of the US economy’s momentum. We combine trends across the dozens and dozens of economic indicators in various categories like manufacturing, employment, housing, the consumer, and inflation to provide a directional overview of the economy.
To access our newest Matrix of Economic Indicators, start a two-week free trial to either Bespoke Premium or Bespoke Institutional now!
My Oh My, What a Month of May
The calendar has turned the page, and May is now in the rearview. Looking back on sector performance during the month, it was certainly one for the history books. In the chart below, we show May performance for the S&P 500 and each of its eleven sectors during the month.
Impressively, the technology sector climbed almost 16% from the end of April to the end of May. Considering it is the most heavily-weighted sector, representing a record 38% of the S&P 500’s market cap, tech’s strength helped to overcome weakness across most other sectors and boost the S&P 500 to a 5.15% gain during the month. Tech was also the only sector to outperform the S&P 500 in May, and just two other sectors were even in the green: Consumer Discretionary and Health Care. Meanwhile, on the other end of the spectrum, Energy and Utilities both fell by over 5%.
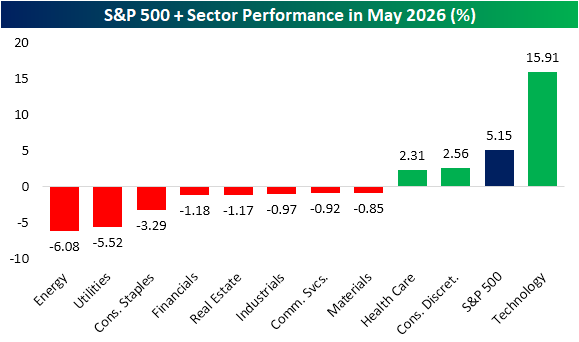
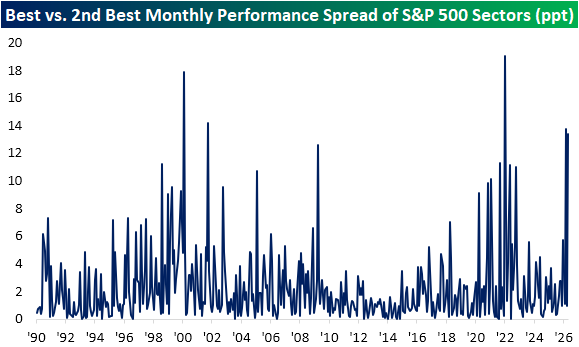
While Consumer Discretionary was higher, it made for a pretty lackluster runner-up. The sector only gained 2.56% in May, which was about half of the S&P 500’s return and a fraction of the huge run in Tech. In fact, it made for one of the largest gaps between the best and second-best performing sectors of any month since at least 1990.
As shown below, only four other months on record saw larger gaps in performance between the best and second-best performing sectors. One was very recently with a 13.73 percentage point spread between Energy (+10.3%) and Utilities (-3.4%) in March, but before that, January 2022 was the most recent with a record-setting 19 percentage point gap between Energy’s 19% gain and Financials’ modest 8 bps decline. Other than that, February 2000 and October 2001 were the only wider divergences.
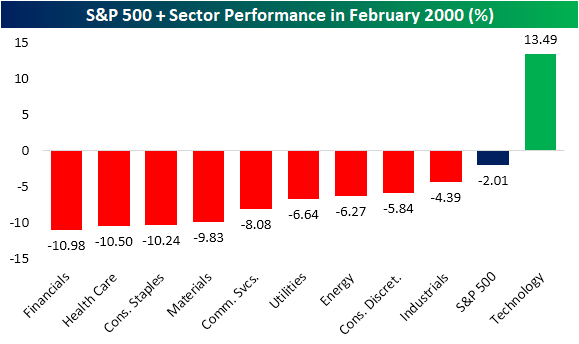
Focusing on the February 2000 instance, we would note that there is one other (maybe concerning) parallel with this past May. February 2000 and this past May are the only months on record in which just a single sector outperformed the S&P 500. In both cases, that outperforming sector – Technology – was the most heavily weighted. Obviously, that 2000 instance was also right before the Dot Com Bubble high the following month.
While that similarity between now and the Dot Com peak may cause concern, we would note that there was also a major difference between February 2000 and last month. In February 2000, as Tech sprinted ahead of the rest of the market, performance from the other sectors was far worse than last month. As shown, multiple sectors fell by over 10% in February 2000 without even one other sector outside of Tech rallying. That compares to last month, when the worst decline was a 6% drop in the recently high-flying Energy sector. Meanwhile, most other sectors were down in the low single digits. In other words, sector bifurcation was far worse 26 years ago.
Zooming in on Tech, May was again a historic month. The sector’s nearly 16% gain was actually a bit smaller than the 17.4% jump it experienced in April. As we highlighted in Friday’s Sector Snapshot, since our data begins in 1990, it was the strongest May on record, and for all months of the year, there have only been 10 others with larger gains (again one of those was this April). Combining the April and May rally, the 36.1% run in that span is the sector’s third strongest two-month rally on record behind November 2001 and November 2002.
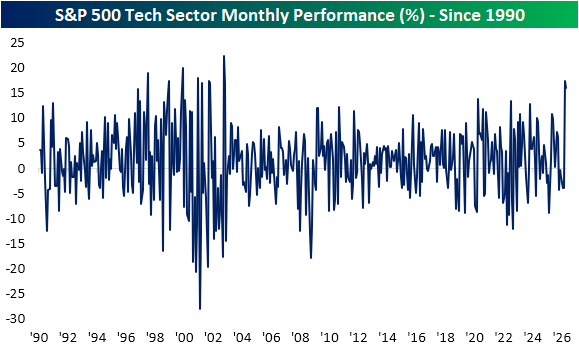
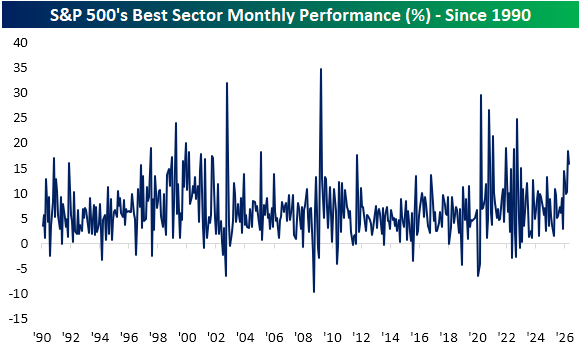
Compared to all sectors across all months, in the chart below, we show the monthly performance of the top-performing sector for all months since 1990. Tech’s rally in May was impressive for another reason as it ranked as the 26th best monthly gain of any sector since 1990. As noted above, Tech also rose 17.4% in April, but that wasn’t the best performer that month. That title belonged to Communication Services, which rallied 18.4% in April. That was the single best monthly performance for any sector since October 2022 when Energy rallied 24.8%. Turning back the calendar just one more month, Energy was this March’s biggest gainer as it rose 10.3% at the onset of the US-Iran war.
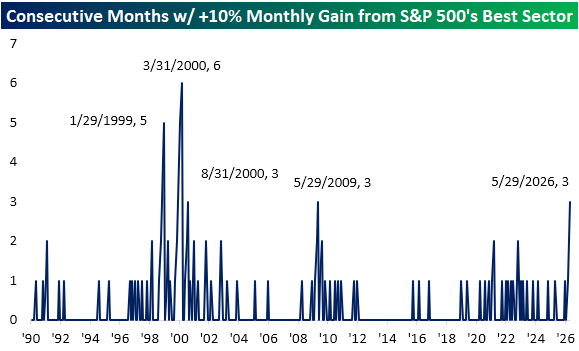
Altogether, that means the S&P 500’s best-performing sector has posted double-digit monthly gains for three months in a row which is the first time that has happened since May 2009. Before that, the only other times this happened were in January 1999 and a couple of times in 2000.
Want more from Bespoke? You can start by joining our Think BIG mailing list where you’ll receive an interesting market stat in your inbox a few times per week. All we need is your email address. Join now by clicking here or on the image below.

Bespoke’s Morning Lineup – 6/1/26 – The Year of Semis
See what’s driving market performance around the world in today’s Morning Lineup. Bespoke’s Morning Lineup is the best way to start your trading day. Read it now by starting a two-week trial to Bespoke Premium. CLICK HERE to learn more and start your trial.
“People talk about AI reducing jobs – complete nonsense. It’s causing more software engineers to be hired.” – Jensen Huang
Below is a snippet of commentary from today’s Morning Lineup. Start a two-week trial to Bespoke Premium to view the full report.
It’s a new month, but the market rally continues to roll on. S&P 500 futures are priced to open 0.2% higher, while the Nasdaq is fractionally higher. Treasury yields are unchanged right around 4.45% while crude oil trades back above $90, as there don’t seem to be any signs of an imminent peace deal or ceasefire. Gold prices are down 1.4% but still above $4,500 per ounce, while weakness in Bitcoin persists as prices fall to their lowest level since April.
Asian and European markets have been mixed to kick off the month, as manufacturing PMI indices have started to hit the tape. Here in the US, we’ll get the S&P 500 and ISM reads on the manufacturing sector at 9:45 and 10:00 AM, respectively.
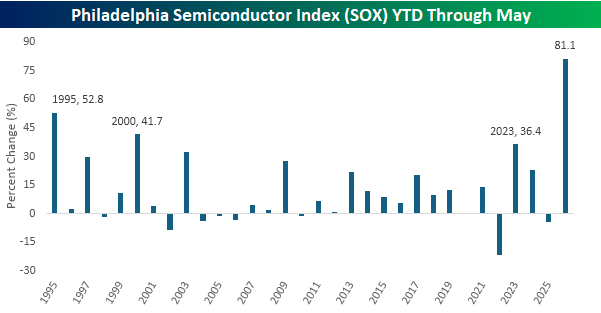
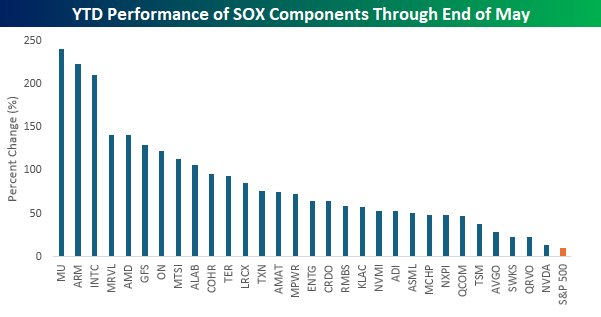
In a speech from Taiwan overnight, Nvidia (NVDA) CEO Jensen Huang called 2026 “the year of agents”. In the evolution of AI, that’s definitely been the case, and the side-effect of that trend in AI is that in the stock market, 2026 has been the year of semiconductors. With a year-to-date gain of 81.1% through the end of May, the Philadelphia Semiconductor Index (SOX) has easily had its best start to a year in its history.
Before 2026, the best start to a year for the SOX was its first full year in 1995, when it rallied 52.8%, or nearly 30 percentage points less than this year’s gain. An 81% gain to start the year is impressive under any circumstances, but when you consider the size of the sector, 81% is almost unbelievable.
Besides having a monster gain at the index level, the rally in semis has been broad. Of the index’s 30 components, eight have more than doubled, including three that are up over 200%. The average gain of all 30 components has been modestly better than the index itself (+87%), indicating that, unlike the S&P 500, it hasn’t been just the biggest stocks in the index driving the gains. Participation has been so broad, in fact, that every stock in the SOX has outperformed the S&P 500 so far this year.
What really stands out about the chart below, though, is NVDA’s performance relative to all the other members of the SOX. With a gain of 13.2% YTD, it’s easily the worst performer in the index and outperforming the S&P 500 by less than three percentage points. So, while all of the major financial outlets are focusing endlessly on last night’s announcements from NVDA out of Taiwan, investors have been looking elsewhere.
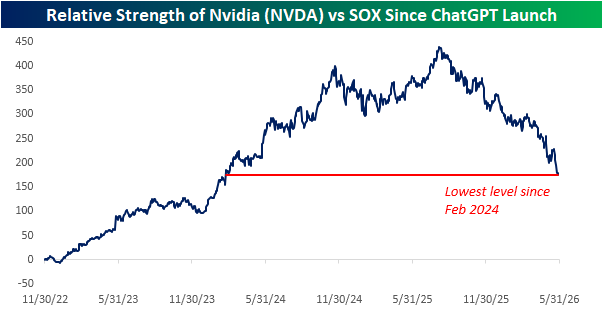
Relative to the rest of the semis space, NVDA has been giving up ground for nearly a year now. The chart below shows the stock’s relative strength versus the SOX since the launch of ChatGPT in late 2022. While the stock saw blistering outperformance in the first two years after ChatGPT’s launch, it moved sideways relative to the SOX for nearly a year, and since last August, it has been steadily giving up ground to the index’s other 29 components.
Start a two-week trial to Bespoke Premium to continue reading today’s full Morning Lineup.