Perfect 10?
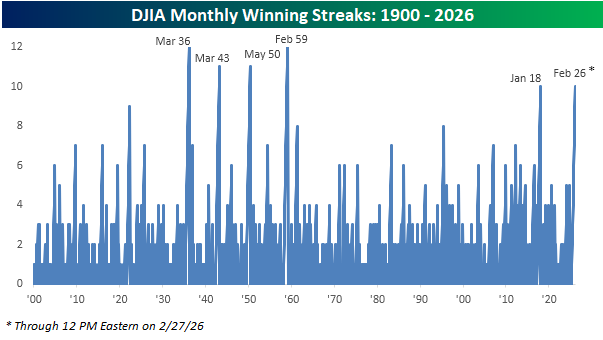
There’s still time in the trading day, but the Dow Jones Industrial Average (DJIA) is barely hanging on to a gain for the month (+0.05%). If it can hold on to these levels, it would extend the current monthly winning streak to ten, tying the streak that ended in January 2018 for the longest since February 1959 (12 months). As shown in the chart below, if the gains for February hold, it would be just the sixth double-digit monthly winning streak in the Dow’s history.
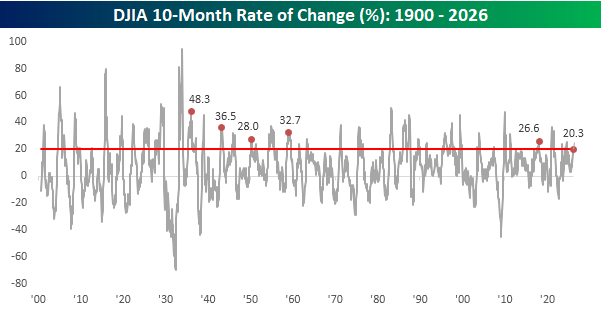
With the Dow up for ten straight months, it’s natural to wonder whether the index is stretched by historical standards. With a gain of just over 20% in the last ten months, its performance ranks in the 81st percentile relative to all other 10-month periods in its history, so the returns have been significantly better than average. However, looking at the chart of the index’s rolling 10-month performance over time shows that relative to prior streaks, the Dow’s gains during this run were actually the lowest of any comparable winning streak in its history. So, yes, the Dow’s performance over the last ten months has been much better than average, but far from extreme.

Steep Drawdowns for PE Stocks
Publicly-traded private equity stocks are taking it on the chin again today, continuing an extremely rough stretch for the group that began in early January. The reason for the recent plunge: fears of over-exposure to software companies that are suddenly at risk of extinction from AI.
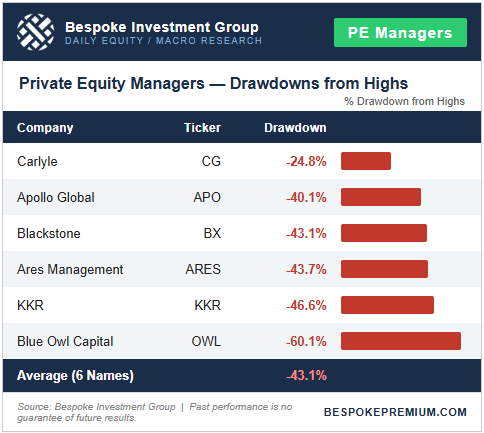
A group of six alternative asset companies that includes well-known firms like Apollo (APO), KKR (KKR), and Blue Owl (OWL) is now in an average drawdown of 43.1% from all-time highs, which were hit in November 2024 shortly after President Trump was re-elected.
Carlyle Group (CG) has so far been spared the most with a drawdown of only 25%. The other five stocks in the table below are all down 40%+ from highs. Blue Owl Capital (OWL) is down by far the most at -60.1%.
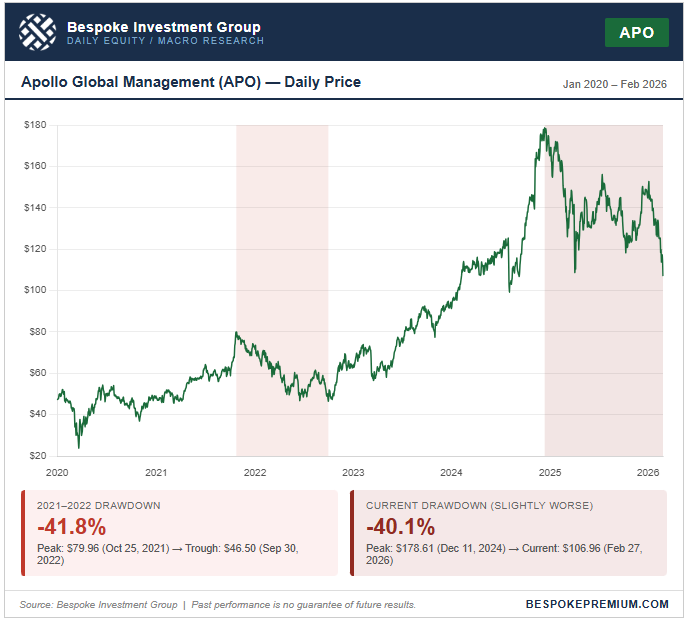
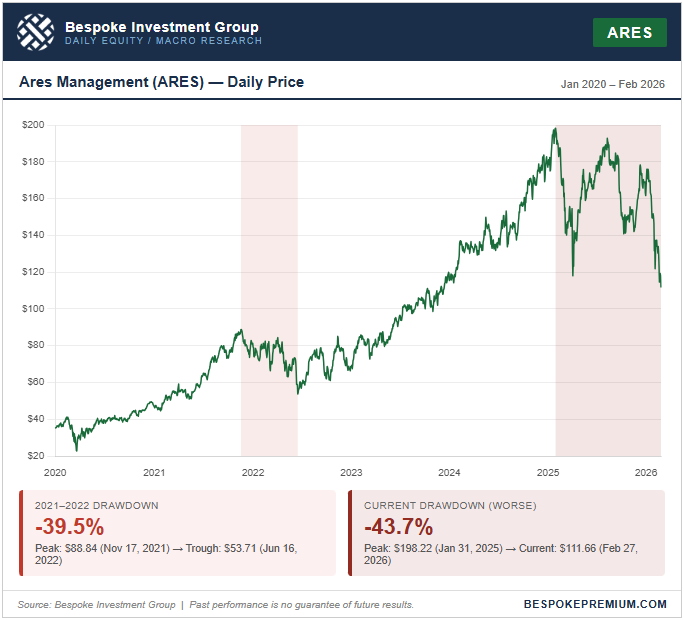
Below are price charts for two of the PE companies in the table above going back to 2020: Apollo (APO) and Ares (ARES).
What’s important to highlight is that the current drawdown in the private equity space is now just as extreme as the one seen during the nasty bear market of 2021/2022 when the SPAC/meme-stock bubble burst. As shown, Apollo (APO) is down 40.1% now versus a peak to trough decline of 41.8% in 2022, while Ares (ARES) is down 43.7% from its November 2024 all-time high versus a drop of 39.5% during the 2021/2022 bear market.
Back in 2022, the broader market fell in lockstep with PE stocks, as the S&P ultimately fell 25% and the tech-heavy Nasdaq 100 fell 35%. So far during the current PE sell-off, the Nasdaq 100 is down less than 5%, while the S&P 500 is 1.5% below all-time highs.
Bespoke’s Morning Lineup – 2/27/26 – Sub 4%
See what’s driving market performance around the world in today’s Morning Lineup. Bespoke’s Morning Lineup is the best way to start your trading day. Read it now by starting a two-week trial to Bespoke Premium. CLICK HERE to learn more and start your trial.
“I wonder why progress looks so much like destruction.” – John Steinbeck

Below is a snippet of commentary from today’s Morning Lineup. Start a two-week trial to Bespoke Premium to view the full report.
Paul Hickey will be a guest on “Making Money with Charles Payne” today at 2 PM on Fox Business. Make sure to check it out!
Futures have been steadily losing steam all morning as the S&P 500 and Nasdaq both look to open down over 0.6%. Weakness has been focused on the usual suspects of software stocks, as Salesforce (CRM) drops 3% while Microsoft (MSFT) falls over 1%. A Disappointing earnings report from CoreWeave (CRWV) hasn’t helped either, as that stock is down over 10%. Nvidia (NVDA) is also adding to yesterday’s 5%+ decline with a drop of 1% in the pre-market.
With the weakness in equities, treasuries are rallying as the 10-year yield falls below 4% for the first time since before Thanksgiving. Oil prices are sharply higher with a gain of more than 3% heading into another weekend of uncertainty over whether the US will attack Iran. That uncertainty also has gold trading nearly 1% higher while other metals see even larger gains. Crypto, however, is down over 2% and back below $66K after trading above $69K two days ago.
Asian markets finished the week mixed but broadly higher for the week. South Korean stocks fell 1% but still gained 7.5% for the week and closed to 20% for February. Not bad for the shortest month of the year! Japan and China traded higher, adding to their gains for the week with Japan up 3.6% and China up 2.0%. Inflation data in Japan decelerated relative to January (1.8% y/y from 2.0%) but was higher than the 1.7% y/y consensus forecast. Japan’s economic minister took the glass-half-full view of the data and commented that inflation is slowing and expects real wages to turn positive in the coming months. In Europe, it’s been a modestly positive session in early trading with the STOXX 600 up 0.2%, putting it on pace for a 0.5% gain for the week. At the country level, markets are broadly higher on both the day and the week.
On the data front, January PPI just hit the tape and came in higher than expected for the second month in a row. Futures have dipped lower in reaction to the report, although the 10-year yield hasn’t moved much in reaction. The only other reports on the calendar between now and the weekend are the Chicago PMI at 9:45 and Construction Spending at 10 AM.
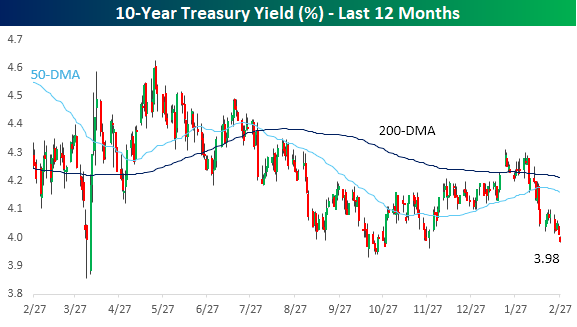
As mentioned above, with the 10-year yield below 4.0%, it is on pace for its first close below 4% since the day before Thanksgiving and the lowest close since late October. As shown in the chart below, if the current levels in the 10-year yield hold, today would be just the ninth time in the last 12 months that the yield closed below 4%. These levels come just over a month after yields were as high as 4.3%, as market fears over inflation outweighed any concerns over future employment losses due to AI. We also wouldn’t be surprised if, at some point in the coming weeks, the narrative shifts once again!
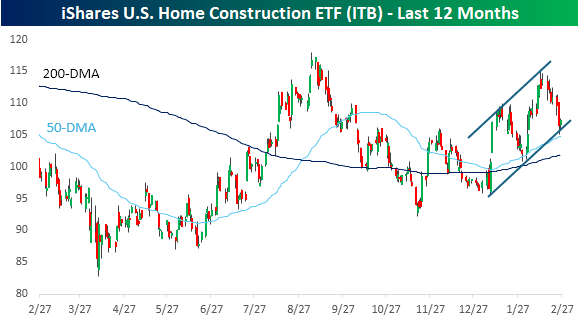
Prime beneficiaries of lower yields are the homebuilders, and up until this week, the group was performing very well, but on Wednesday, the iShares US Home Construction ETF (ITB) fell more than 3% following the President’s State of the Union (SOTU) speech. Usually, when a stock or sector falls after one of the President’s speeches, it’s because he said something combative about it. In this case, though, it was what the President didn’t say.
Despite being the longest SOTU speech of all time, the speech was noted for its lack of any meaningful comments regarding housing or increasing housing supply. In fact, the only real mention of housing was in protecting home prices, which can only be done by lowering demand or not meaningfully increasing supply.
While homebuilder stocks had their worst day in over six months the day after the President’s SOTU speech, ITB remains in a steady uptrend and bounced yesterday right at the bottom of that trend channel. If rates remain below 4%, a move back to the high end of that range wouldn’t be an unreasonable expectation.
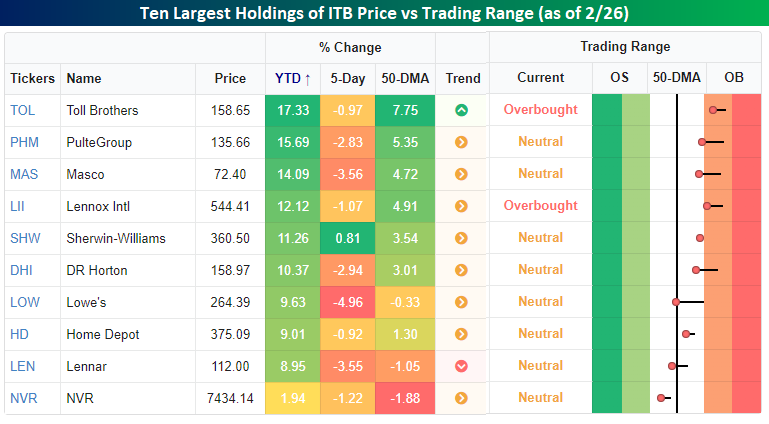
It’s been a good year all around for homebuilders and housing-related stocks. Of the ten largest holdings in ITB, all but one are up at least 8% YTD, even after this week’s declines. Pure-play homebuilders have led the ETF’s gains, with Toll Brothers (TOL) and PulteGroup (PHM) both rallying more than 15% YTD.
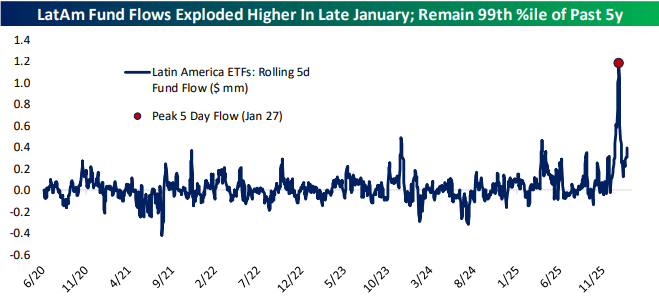
The Closer – AI, Earnings, LatAm – 2/26/26
Log-in here if you’re a member with access to the Closer.
Looking for deeper insight into markets? In tonight’s Closer sent to Bespoke Institutional clients, we begin with a recap of the AI stocks today including those tied with OpenAI (page 1). Next up, we give a rundown of the latest earnings reports (page 2) followed by a look into the performance of Latin American stocks (page 3). We then finish with a review of recent job postings data from Indeed (pages 4 and 5).
See today’s full post-market Closer and everything else Bespoke publishes by starting a 14-day trial to Bespoke Institutional today!
The Bespoke 50 Growth Stocks – 2/26/26
The “Bespoke 50” is a basket of noteworthy growth stocks in the Russell 3,000. To make the list, a stock must have strong earnings growth prospects along with an attractive price chart based on Bespoke’s analysis. There were 8 changes to the list this week.
The Bespoke 50 is available with a Bespoke Premium subscription or a Bespoke Institutional subscription. With Bespoke Premium, you’ll receive a number of daily market updates from us along with our weekly newsletter and a portion of our investor tools. With Bespoke Institutional, you’ll receive everything that’s included with Premium plus additional daily macro analysis and more stock-specific research.
To see all 50 stocks that currently make up the Bespoke 50, simply start a two-week trial to Bespoke Premium or Bespoke Institutional.
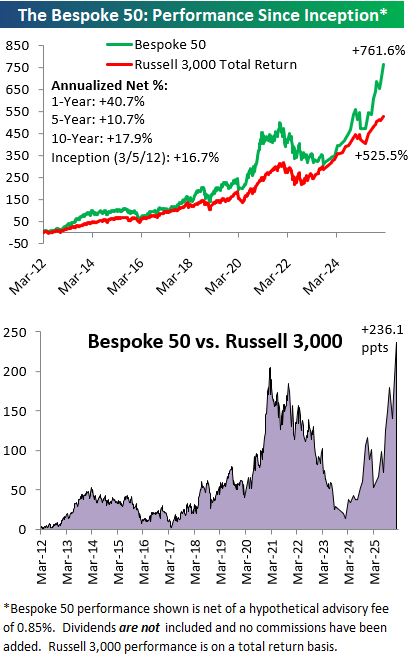
The Bespoke 50 performance chart shown does not represent actual investment results. The Bespoke 50 is updated monthly on Thursdays unless otherwise noted. Performance is based on equally weighting each of the 50 stocks (2% each) and is calculated using each stock’s opening price as of Friday morning after publication. Entry prices and exit prices used for stocks that are added or removed from the Bespoke 50 are based on Friday’s opening price. Any potential commissions, brokerage fees, or dividends are not included in the Bespoke 50 performance calculation, but the performance shown is net of a hypothetical annual advisory fee of 0.85%. Performance tracking for the Bespoke 50 and the Russell 3,000 total return index begins on March 5th, 2012 when the Bespoke 50 was first published. Past performance is not a guarantee of future results. The Bespoke 50 is meant to be an idea generator for investors and not a recommendation to buy or sell any specific securities. It is not personalized advice because it in no way takes into account an investor’s individual needs. As always, investors should conduct their own research when buying or selling individual securities. Click here to read our full disclosure on hypothetical performance tracking. Bespoke representatives or wealth management clients may have positions in securities discussed or mentioned in its published content.
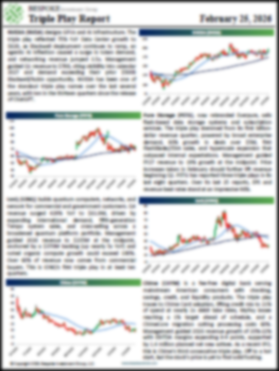
The Triple Play Report: 2/25/26
An earnings triple play is a stock that reports earnings and manages to 1) beat analyst EPS estimates, 2) beat analyst sales estimates, and 3) raise forward guidance. You can read more about “triple plays” at Investopedia.com where they’ve given Bespoke credit for popularizing the term. We like triple plays as an indication that a company’s business is firing on all cylinders, with better-than-expected results and an improving outlook. A triple play is indicative of positive “fundamental momentum” instead of pure fundamentals, and there are always plenty of names with both high and low valuations on our quarterly list.
Bespoke’s Triple Play Report covers what each company does, what this quarter’s results say about their growth outlooks, and their histories of delivering triple plays. Bespoke’s Triple Play Report is available at the Bespoke Institutional level only. You can sign up for Bespoke Institutional now and receive a 14-day trial to read today’s Triple Play Report. To sign up, choose either the monthly or annual checkout link below:
Bespoke Institutional – Monthly Payment Plan
Bespoke Institutional – Annual Payment Plan
Bespoke Investment Group, LLC believes all information contained in these reports to be accurate, but we do not guarantee its accuracy. None of the information in these reports or any opinions expressed constitutes a solicitation of the purchase or sale of any securities or commodities. This is not personalized advice. Investors should do their own research and/or work with an investment professional when making portfolio decisions. As always, past performance of any investment is not a guarantee of future results. Bespoke representatives or clients may have positions in securities discussed or mentioned in its published content.
NVDA Down Again on Earnings; AI Mentions Also Down
NVIDIA (NVDA) is down 5% today following yet another earnings triple play after the close yesterday. Barring a massive turnaround in the last hour of trading, this will be the seventh straight quarter where NVDA shares fell from the open to the close of trading on the day after it reports earnings.
Below is a snapshot of NVDA quarterly earnings versus estimates since ChatGPT’s release at the end of 2022. Out of 13 total quarterly reports, NVDA has reported ten triple plays (beat EPS, beat sales, raised guidance).
In its first six earnings reports following the release of ChatGPT, NVDA shares averaged a one-day gain of 10% on its earnings reaction day. Following its last seven reports, though, shares have averaged a decline of 3% for an overall average of 3.2%.

Now that NVDA has reported and completed its conference call, we can update our chart of “AI” mentions from the mega-cap hyperscalers this earnings season. Across the conference calls of Apple (AAPL), Amazon (AMZN), Alphabet (GOOGL), Meta (META), Microsoft (MSFT), and NVIDIA (NVDA), “AI” was mentioned 348 times this quarter. As shown below, that’s down quite a bit from the 401 “AI” mentions last quarter, and it’s 102 fewer than the peak “AI” reached during the Q1 2025 earnings season.
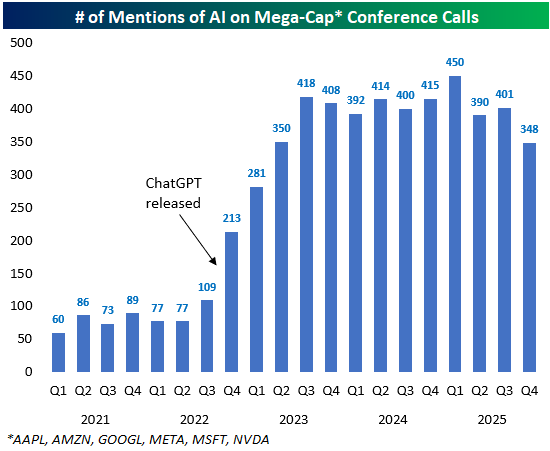
Below is a breakdown of “AI” mentions by stock going back to 2001.
This quarter, Amazon (AMZN) and Apple (AAPL) were the only two that mentioned “AI” more on conference calls, with AMZN mentioning it a record 61 times.
META mentioned AI just 45 times, the lowest since Q4 2023, while NVDA’s 82 mentions was the lowest since the last earnings season before ChatGPT’s release!

Bespoke’s Morning Lineup – 2/26/26 – To the Moon!
See what’s driving market performance around the world in today’s Morning Lineup. Bespoke’s Morning Lineup is the best way to start your trading day. Read it now by starting a two-week trial to Bespoke Premium. CLICK HERE to learn more and start your trial.
“Bang! Zoom! To the moon, Alice!” – Jackie Gleason
Below is a snippet of commentary from today’s Morning Lineup. Start a two-week trial to Bespoke Premium to view the full report.
Equity futures have moved fractionally into positive territory off their overnight lows as shares of Nvidia (NVDA) turned positive with a gain of nearly 1%. The 10-year yield is down 1 bps to 4.04% while crude oil trades down 2% to $64 per barrel. Gold prices are also down by about 0.5%, while silver plunges nearly 5% and Bitcoin drops over 1% to just over $68K.
Asia was mostly positive overnight. The Nikkei finished higher by a modest 0.3%, and Hong Kong declined more than 1%. South Korean stocks, however, continued to surge as the KOSPI rallied 3.7%, taking its YTD gain to 49.7%! Nearly 50%! Japanese PM Takaichi nominated two dovish candidates for roles within the BoJ, and the yen is weakening as markets now price the odds of a rate hike in April down to just 50%. This comes even as Leading Indicators in Japan came in better than expected.
European stocks are positive again this morning, with the STOXX 600 up 0.2%, with France’s 0.9% gain leading the way higher. February Business and Consumer Confidence unexpectedly declined, although Confidence in Italy bounced.
In the US this morning, the only reports on the calendar are Jobless Claims at 8:30, followed by the KC Fed Manufacturing report at 11. At 10 AM Eastern, Fed Governor Bowman will also testify in front of a Senate panel.
Jackie Gleason, best known as the hot-tempered bus driver Ralph Kramden from the 1950s sitcom The Honeymooners, would have turned 110 years old today. Ralph’s most iconic line from the show was “To the moon, Alice”, and that’s the way things seem to be going for semiconductor stocks. While Nvidia’s (NVDA) stock price, despite surging profits and revenues, has been rangebound for months now, the Philadelphia Semiconductor Index (SOX) hit another record high yesterday, taking its YTD gain to just under 20%.
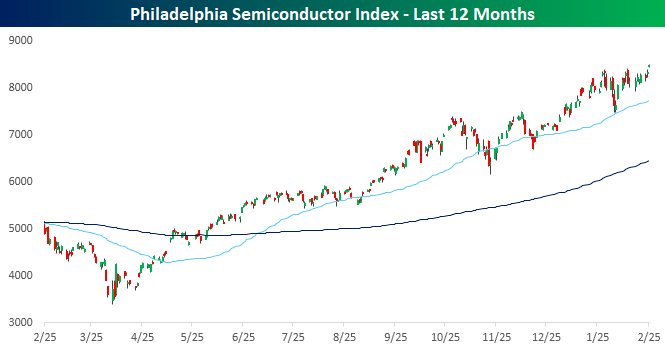
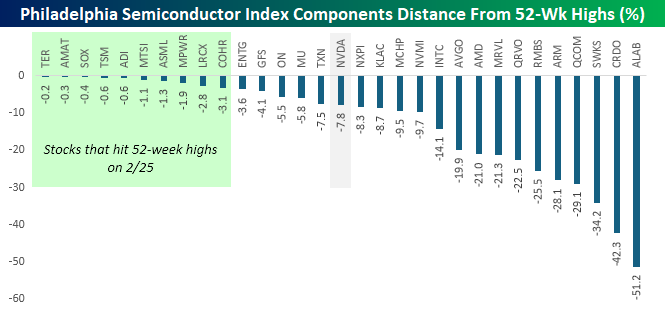
Along with the index itself, breadth in the sector has also been strong. Yesterday alone, nine of the index’s 30 components hit 52-week highs, even as NVDA closed nearly 8% below its respective high.
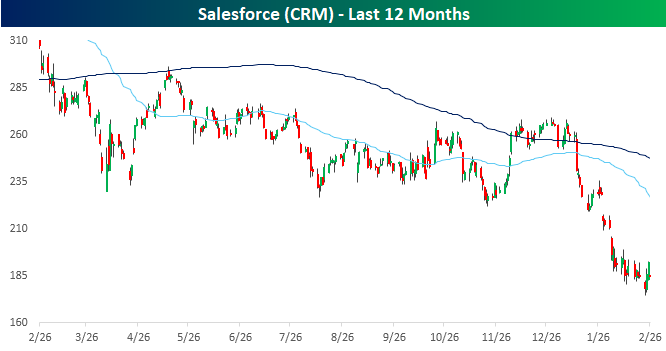
While semis have been strong, software stocks continue to try digging out from the AI-pocalypse. The latest setback for the sector was earnings from Salesforce (CRM) last night. CRM exceeded EPS forecasts on inline revenues. Guidance was mixed with the company raising Q1 EPS forecasts while keeping full-year forecasts in line with expectations. Despite a somewhat positive report at the surface, CRM is down more than 2% in the pre-market.
As software stocks have been cratering in recent weeks, investors have been asking where company managements are with respect to purchasing their stocks. If the declines were a major overreaction, as CRM CEO Benioff and others say, shouldn’t they be buying back stock hand over fist?
CRM addressed that last night when the company announced a $50 bln buyback. CRM’s market cap is $180 billion, so $50 billion represents more than a quarter of the company’s entire market cap. Ideally, investors would like to see company executives putting their own actual money where their mouths are, but a $50 billion stock buyback is a step in the right direction.
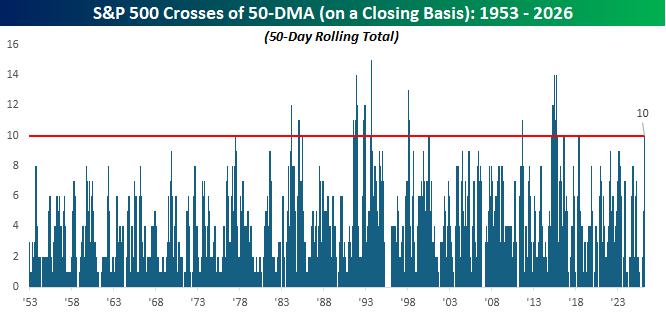
Semis and software are two of the market’s largest sectors, and each one moving in the opposite direction has contributed to the ping pong action at the overall index level. As we noted on X yesterday, the S&P 500 has now crossed its 50-day moving average on a closing basis ten times in the last 50 trading days. That’s the longest streak since March 2018 and one of only a handful of periods with that many crosses in such a short period of time. As we’ve all said to someone close to us multiple times, make up your mind already!
The Closer – Factors and Baskets – 2/25/26
Log-in here if you’re a member with access to the Closer.
Looking for deeper insight into markets? In tonight’s Closer sent to Bespoke Institutional clients, we provide a rundown for a number of thematic moves recently including the relationships between growth, value, and momentum (page 1). We also show the performance of baskets like AI Picks and Shovels, Durable Goods, Autos, and more (pages 2-4).
See today’s full post-market Closer and everything else Bespoke publishes by starting a 14-day trial to Bespoke Institutional today!
Q4 2025 Earnings Conference Call Recaps: Lowe’s (LOW)
Bespoke’s Conference Call Recaps use AI to summarize lengthy earnings calls. The commentary below is AI-generated and then edited by Bespoke for quality control. As always, none of these summaries should be construed as recommendations to buy or sell any securities, and investors should do their own research and/or consult with a financial professional before making any investment decisions.
Our latest recap available to Bespoke subscribers covers Lowe’s (LOW) Q4 2025 earnings call.
![]()
Lowe’s (LOW) is the second-largest home improvement retailer in the world, operating approximately 1,700 stores across the United States. The company serves both do-it-yourself homeowners and professional contractors, offering everything from appliances and building materials to installation services. Lowe’s delivered Q4 comparable sales growth of 1.3% and full-year sales of $86.3 billion, but management struck a cautious tone for 2026, guiding comparable sales of flat to up 2% against a home improvement market they expect to be roughly flat. The central headwind remains elevated mortgage rates and the lock-in effect, suppressing housing turnover, though rates briefly dipped below 6% this week. Big-ticket discretionary DIY spending continues to be deferred. Pro customer growth was a standout, with the Pro extended aisle exceeding expectations and new AI-powered tools improving sales interactions. LOW shares fell as much as 5.7% on 1/25 despite beating EPS and revenue estimates…
Continue reading our Conference Call Recap for LOW by becoming a Bespoke Institutional subscriber. You can sign up for Bespoke Institutional now and receive a 14-day trial to read our newest Conference Call Recap. To sign up, choose either the monthly or annual checkout link below: