The Closer – Curve Flattener, Jobs Day, Data Center Shadows – 7/2/26
Log-in here if you’re a member with access to the Closer.
- Germany’s DAX surged close to 2% today to finish with a fresh all-time high.
- Weekly jobless claims data continues to show a robust labor market although jobs growth according to the Nonfarm Payrolls report decelerated.
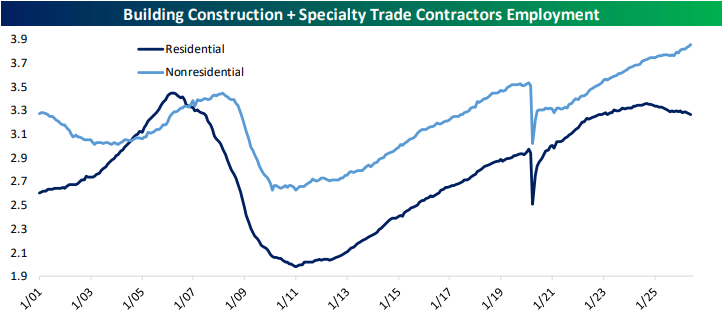
- The massive increase in construction labor demand from data centers is serving a useful purpose: masking the slowdown in housing activity.
See today’s full post-market Closer and everything else Bespoke publishes by starting a 14-day trial to Bespoke Institutional today!
“Yes, Sir!”
President Trump took to the Truth Social machine earlier this week to air his frustration with the petroleum industry when he demanded that “Gasoline Retailers must get their Prices down, IMMEDIATELY!”
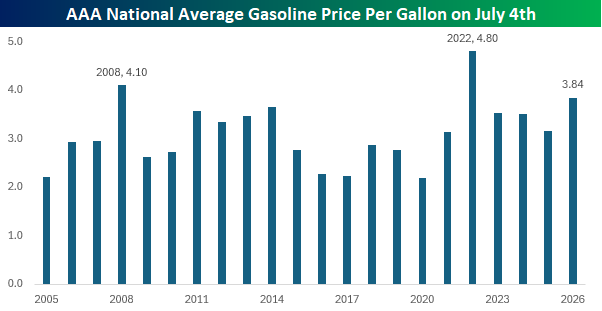
A look at where prices stand now relative to July 4th in prior years shows that the current AAA national average price for a gallon of gas is the third highest of any year since at least 2005. The only two years when prices were higher were in 2008 ($4.10) and 2022 ($4.80). Besides the high level of prices, this year’s 35.5% YTD gain also ranks as the fourth-largest YTD increase since 2005.
Higher gas prices are one area where inflation is most noticed by the consumer, so having these price levels heading into midterms is not what anyone in office wants to see. We can certainly understand the President’s frustration, but does he have a point?
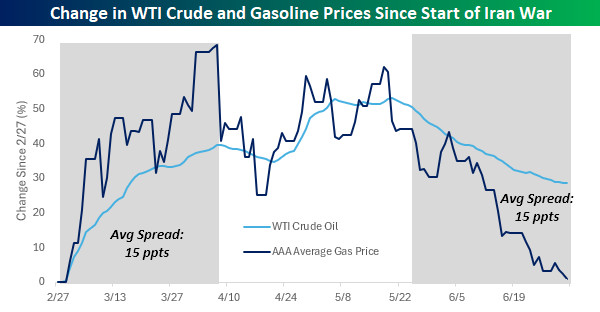
The chart below compares the change in crude oil and gasoline prices since the start of the war in late February. As of this morning, WTI crude oil prices have essentially round-tripped the gains they saw early on in the war. The same can’t be said for prices at the pump, though, as they’re still up 29% since 2/27. While crude oil prices have fallen rapidly, gas prices have been much slower to respond.
If crude oil prices remain at these levels, prices at the pump will follow. In addition to the positive correlation to oil prices, average gas prices also have a consistent seasonal tendency to decline in the second half of the year.
Are gas prices artificially high, though? Not necessarily. While they’ve been much slower to follow crude oil prices lower in the last few weeks, gas prices were also slower to respond to the rise in crude oil prices. For example, in the six weeks leading up to the peak in crude oil prices on 4/7, the average spread between the percentage gain in crude oil prices versus the increase in gas prices was 15 percentage points. Conversely, in the six weeks leading up to today, the average percentage spread between the two was also 15 percentage points but in the opposite direction.
Gas stations are an easy target when crude oil prices fall, but looking at the pattern between the two since the war started shows that they are probably just working through the same lag that cushioned the blow for consumers on the way up. With crude back to pre-war levels, a meaningful drop in prices at the pump won’t just be a reaction to the President’s demand, but the natural, lagged result of the fall in crude oil prices.
Want more from Bespoke? You can start by joining our Think BIG mailing list, where you’ll receive an interesting market stat in your inbox a few times per week. All we need is your email address. Join now by clicking here or on the image below.

Bespoke’s Morning Lineup – 7/2/26 – Happy 250th
See what’s driving market performance around the world in today’s Morning Lineup. Bespoke’s Morning Lineup is the best way to start your trading day. Read it now by starting a two-week trial to Bespoke Premium. CLICK HERE to learn more and start your trial.
“Philosophy is common sense with big words.” – James Madison

Below is a snippet of commentary from today’s Morning Lineup. Start a two-week trial to Bespoke Premium to view the full report.
After a shaky start to the third quarter yesterday, equity futures remained wary ahead of the June Non-Farm Payrolls report, with the S&P 500 basically unchanged while the Nasdaq was up less than 10 basis points. Treasury yields are slightly higher, but the 10-year yield is back above 4.5%. The real story, though, is in the energy market, where WTI prices are down over 2% and back to where they traded before the war with Iran started. Gold prices are down fractionally, and Bitcoin is higher, trading back above $61K.
In Asia, it was a shaky night led lower by tech stocks as South Korea plunged nearly 8%, the Nikkei fell 2.5%, and China dropped 2%. That’s not the start of a quarter bulls would have hoped for, but it’s also not unexpected given the moves higher we saw in Q2.
In Europe, stocks are broadly higher with the STOXX 600 trading up over 0.5%, as Italy and Spain lead the way, gaining over 1%.
It’s a busy day for economic data as we pack a lot of reports into the day due to Friday’s holiday. The main report, though, was the Non-Farm Payrolls report, which came in weaker than expected. The initial read was 57K, or about half expectations. Despite the weaker print, the Unemployment Rate dropped to 4.2% versus forecasts for 4.3%. Also, Initial and Continuing Claims were both slightly lower than expected. So, the headline number may have been weaker than expected; other releases weren’t nearly as bad. When it comes to the Non-Farm Payrolls, the most important thing to remember is that the initial release is what you tell your wife you’re going to spend at Costco, and the revision is your credit card statement. They’re rarely the same!
As we kick off the second half, investors face no shortage of questions. Will earnings season live up to expectations? Will inflation cool? Will the ceasefire in the Middle East continue? Will the AI trade continue to keep the market afloat, or will the underperformance of mega-caps sink the rally? We can all take our best guesses at these questions, but only time will tell, and as events unfold, the market will continue to react with gains and losses.
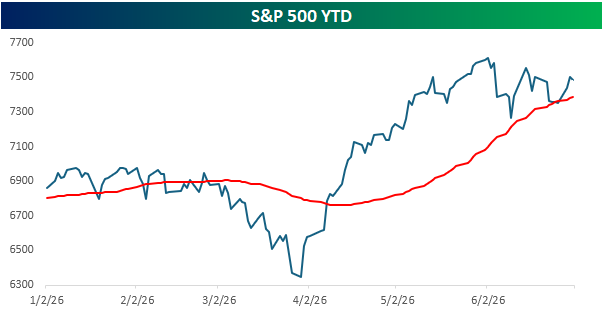
After a blistering rally off the March lows, investors are starting to question their recent optimism, which has caused the advance to stall. Heading into the last trading session before the July 4th holiday, the S&P 500 sits just above its 50-day moving average, so even on a short-term basis, the rally remains in place despite the sawtooth action of the last six weeks.
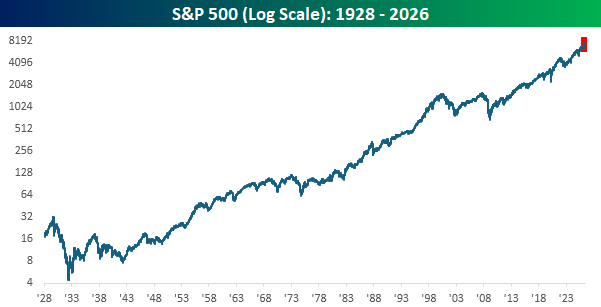
Regardless of how the market responds to these short-term questions, the most important thing to keep in mind is that over the last 250 years (to the day Saturday!), there has been no better investment than the US economy. The chart below goes back nearly a century, and the trend has been clear. It hasn’t been a straight line higher, but the last six months (red box) look inconsequential, and even the dark days of the Great Depression and the unwinding of the 1990s tech bubble don’t seem that bad. Most importantly, though, we got through them.
In real time, the road ahead won’t be smooth, but time has a way of smoothing out the rough edges, and $1 invested in the S&P 500 in 1928 would be worth more than $10,000 today. So, let’s all celebrate this weekend what makes this country the greatest place on earth and get back to work next week in the pursuit of making that $10,000 worth $100,000,000 by 2126! Happy 250th, everyone!
Start a two-week trial to Bespoke Premium to continue reading today’s full Morning Lineup.
The Closer – Momentum Mess, Drawdown, Job Postings – 7/1/26
Log-in here if you’re a member with access to the Closer.
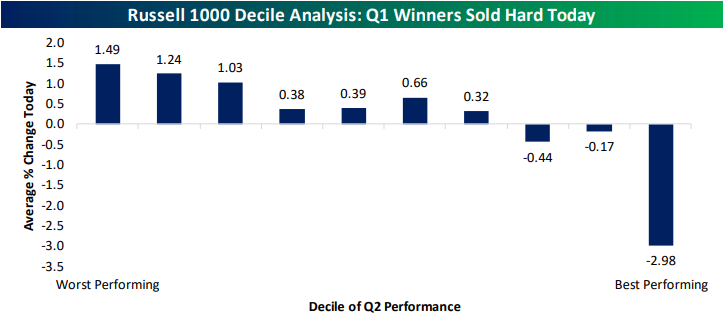
- With massive rotation today, the best-performing decile of Russell 1,000 stocks from last quarter collapsed 2.98% while the bottom three deciles were all up over 1%.
- Crude oil inventories have reached multi-decade lows and when excluding strategic reserves, inventories are at the lowest levels since 2018.
- Job postings data from Indeed has recently diverged from the recent move high in JOLTS job openings.
See today’s full post-market Closer and everything else Bespoke publishes by starting a 14-day trial to Bespoke Institutional today!
Q2 2026 Earnings Conference Call Recaps: FactSet (FDS)
Bespoke’s Conference Call Recaps use AI to summarize lengthy earnings calls. The commentary below is AI-generated and then edited by Bespoke for quality control. As always, none of these summaries should be construed as recommendations to buy or sell any securities, and investors should do their own research and/or consult with a financial professional before making any investment decisions.
Our latest recap available to Bespoke subscribers covers FactSet’s (FDS) Q3 2026 earnings call.
![]()
FactSet (FDS) sells financial data, research tools, and portfolio software to asset managers, banks, and other large financial institutions. Its platform reaches nearly 250,000 users and serves 95 of the top 100 asset managers and more than 85% of the top 50 global investment banks, giving investors insight into institutional spending, market-data demand, financial-industry technology adoption, and the changing way investment professionals work. FactSet’s growth picked up again, with annual subscription value (ASV) rising 7.1% to $2.48 billion across every region and customer group. AI is becoming a measurable driver of sales as more than 10% of the quarter’s growth came directly from AI products, and clients using FactSet’s AI tools are growing their spending faster than the rest of the customer base. Demand for its MCP data connections also jumped, with usage reaching 13 times the prior quarter’s level. The company is also moving customers away from simple per-user licenses and into broader, longer-term contracts that cover more data and services. In reaction to better-than-expected results, shares of FDS rose more than 5% on 7/1…
Continue reading our Conference Call Recap for FDS by becoming a Bespoke Institutional subscriber. You can sign up for Bespoke Institutional now and receive a 14-day trial to read our newest Conference Call Recap. To sign up, choose either the monthly or annual checkout link below:
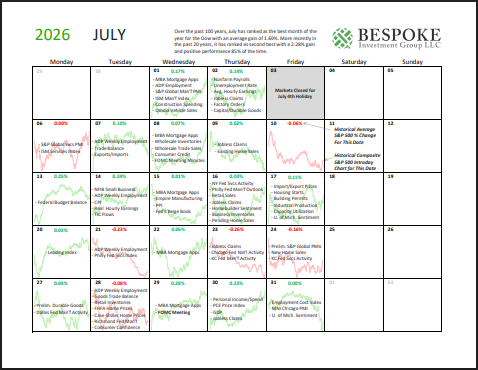
Bespoke Market Calendar — July 2026
Please click the image below to view our July 2026 market calendar. This calendar includes the S&P 500’s historical average percentage change and average intraday chart pattern for each trading day during the upcoming month. It also includes market holidays and options expiration dates plus the dates of key economic indicator releases.Click here to view Bespoke’s premium membership options.
Q2 2026 Earnings Conference Call Recaps: Constellation Brands (STZ)
Bespoke’s Conference Call Recaps use AI to summarize lengthy earnings calls. The commentary below is AI-generated and then edited by Bespoke for quality control. As always, none of these summaries should be construed as recommendations to buy or sell any securities, and investors should do their own research and/or consult with a financial professional before making any investment decisions.
Our latest recap available to Bespoke subscribers covers Constellation Brands’ (STZ) Q1 2027 earnings call.
![]()
Constellation Brands (STZ) is a major producer and marketer of beer, wine, and spirits, best known in the US for Modelo Especial, Corona, Pacifico, and other popular brands. Its premium portfolio and heavy exposure to Hispanic beer consumers make the company a useful read on discretionary spending, social drinking occasions, pricing, and changing preferences across alcoholic and non-alcoholic beverages. Beer shipments rose 1.8%, helping beer gross margin reach 39%, but management described an unusually volatile demand environment. Strong March spending weakened after average US gas prices rose more than 50%, or roughly $1.60 per gallon, before modestly improving as fuel pressure eased. Hispanic communities remained weaker than the general population, while Texas and Florida lagged, and California improved. STZ is responding with smaller and larger pack formats to serve a “K-shaped” consumer and heavier World Cup and football marketing. Modelo still has meaningful brand awareness and distribution gaps, while Corona needs more everyday activation rather than broader availability. Corona Non-Alcoholic is growing at a double-digit rate and has become the category’s fourth-largest brand, while Chelada would rank as the third-largest RTD (Ready-to-Drink) business if classified separately. While revenue fell 3.3% YoY, results on the top and bottom lines beat estimates. Shares are down 2% on 7/1…
Continue reading our Conference Call Recap for STZ by becoming a Bespoke Institutional subscriber. You can sign up for Bespoke Institutional now and receive a 14-day trial to read our newest Conference Call Recap. To sign up, choose either the monthly or annual checkout link below:
Bespoke’s Morning Lineup – 7/1/26 – A Party of One
See what’s driving market performance around the world in today’s Morning Lineup. Bespoke’s Morning Lineup is the best way to start your trading day. Read it now by starting a two-week trial to Bespoke Premium. CLICK HERE to learn more and start your trial.
“Either write something worth reading or do something worth writing.” – Benjamin Franklin
Below is a snippet of commentary from today’s Morning Lineup. Start a two-week trial to Bespoke Premium to view the full report.
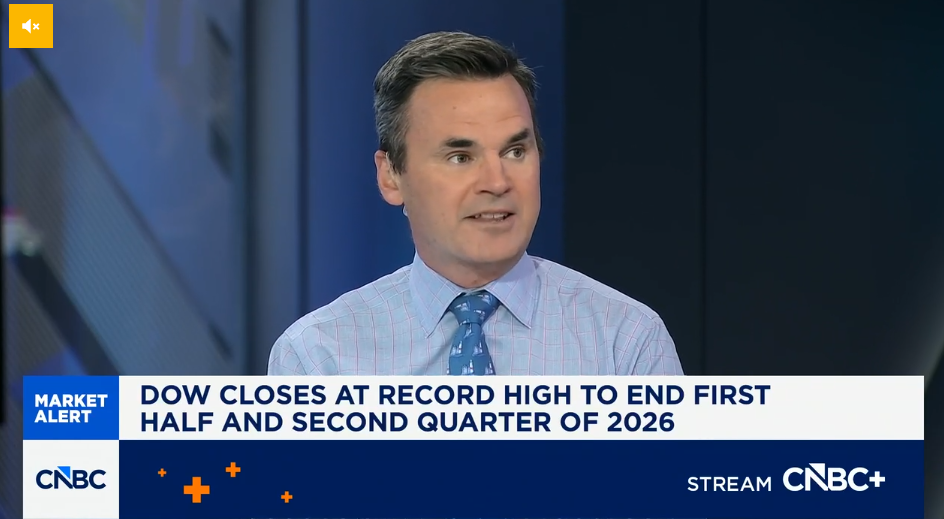
Paul Hickey appeared on CNBC’s Closing Bell Overtime yesterday after the close to discuss the first half performance and trends to look for in the second half. To view the segment, click on the image below. Paul will also be appearing on CNBC’s Power Lunch today at 2 PM.
Equity futures are kicking off the new half with modest losses. S&P 500 futures are down 0.2% while the Nasdaq is down 0.5%. Treasury yields are seeing a sizable uptick, with the 10-year yield up 7 basis points to 4.49%. Crude oil is fractionally lower and below $70 per barrel, while gold is fractionally higher and Bitcoin is marginally lower.
In Asia, markets started the quarter mixed, with the Nikkei gaining 0.6% as the yen weakened to 40+ year lows. China was also slightly higher, while South Korea declined by 2% as memory stocks showed weakness at the start of the quarter. In terms of regional economic data, manufacturing PMI indices were generally weaker than expected.
In Europe, stocks are mostly lower to start the month, but again, the losses are modest with the STOXX 600 trading down just 0.3%. Manufacturing PMIs were mixed, but the flash CPI for June unexpectedly declined 0.1% m/m, versus forecasts of a 0.1% increase.
On the economic calendar, we’ll get Manufacturing PMIs from S&P and ISM at 9:45 and 10, and the June ADP employment report just hit the tape with a weaker-than-expected print. While economists expected an increase of 120K jobs, the actual increase was just 98K. While weaker than expected, a miss that small relative to expectations will do little to upend the theme of an improved labor market.
In central bank news, we’ll hear from Fed Chair Kevin Warsh, along with ECB President Lagarde, in Sintra, Portugal, later this morning.
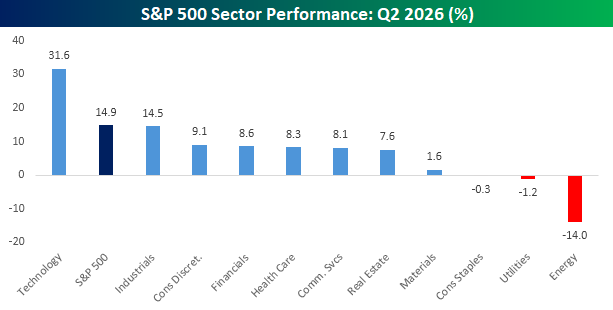
As we start a new month and quarter, we’d be remiss if we didn’t point out how unique the second quarter was in terms of sector performance. While the S&P 500 rallied nearly 15%, the only sector that generated any alpha and outperformed the index was Technology, and boy did it ever outperform as it more than doubled the gain of the S&P 500. Behind Technology, Industrials came close to the S&P 500 but finished just short with a gain of 14.5%.
Outside of these two sectors, no other sector even rallied more than 10%, and three sectors – Consumer Staples, Utilities, and Energy – all finished down for the quarter. That’s not particularly good if your portfolio is concentrated in those three sectors, but when the market rallies, it’s exactly the defensive sectors like these that you would expect to underperform.
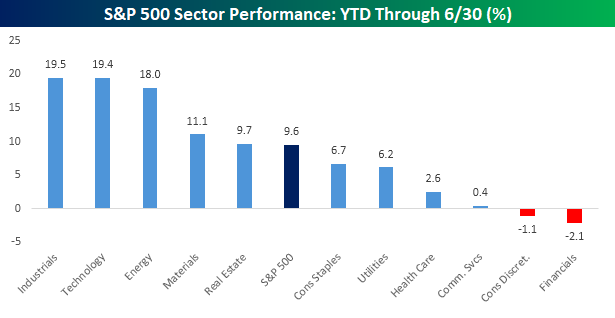
While there was very little in the way of sector breadth during the quarter, on a year-to-date basis, performance has been more balanced. As shown in the chart below, while the S&P 500 is up just under 10%, Industrials, Technology, and Energy all gained nearly double that, while Materials and Real Estate also outperformed. To the downside, Consumer Discretionary and Financials are the only two sectors in the hole for the year. If the economy continues to show signs of improvement in the second half, it would be hard to imagine these two sectors continuing to remain in the red.
Start a two-week trial to Bespoke Premium to continue reading today’s full Morning Lineup.
The Closer – Record Setting Quarter, College Grads, Jobs – 6/30/26
Log-in here if you’re a member with access to the Closer.
- It was a historic quarter for equities that included the second best return of the past quarter century for the NASDAQ 100 and the best quarter on record for the semis.
- Data from the New York Fed showed that rising unemployment rates for recent college grads have long pre-dated AI.
- May job openings data reported by the BLS came in much stronger than expected and counter to the past few months moves in alternative data sources.
See today’s full post-market Closer and everything else Bespoke publishes by starting a 14-day trial to Bespoke Institutional today!
Mind the Gap
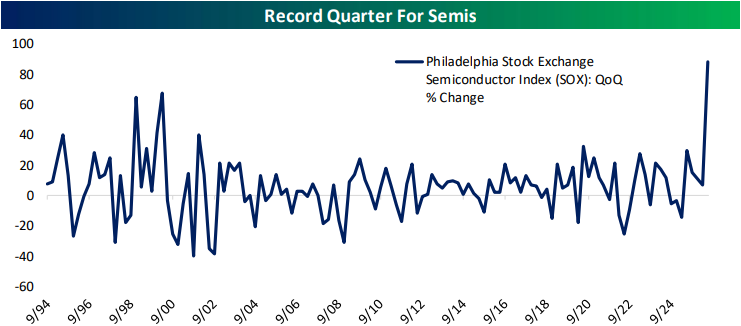
The quarter is coming to a close, and if there is one part of the market that is turning the calendar as a winner, it’s the semiconductors. As we noted in yesterday’s Chart of the Day, of all S&P 500 industry groups, the semis blew away the rest of the pack this quarter.
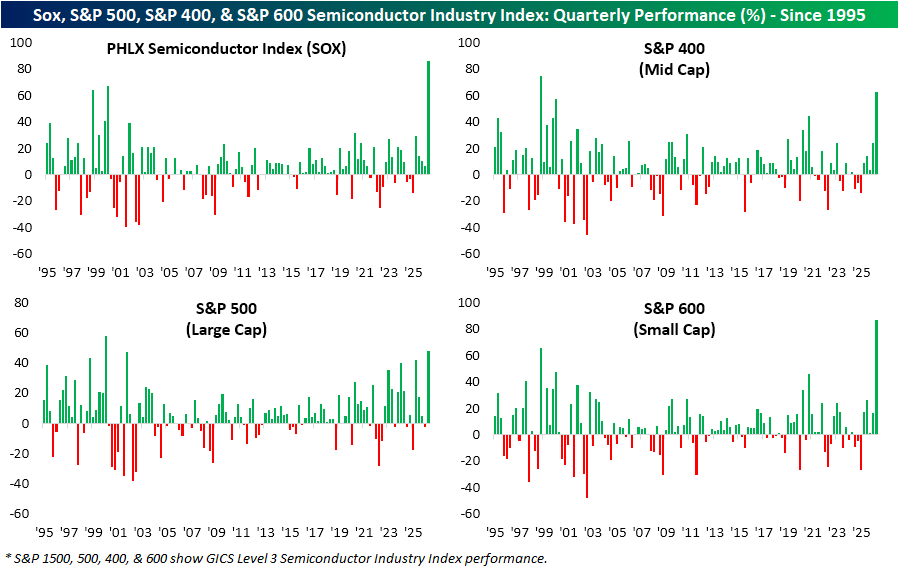
There are multiple ways to look at the semis. While squaring away S&P 500 members that are part of the industry is one option, another more widely quoted version is the PHLX Semiconductor Index (SOX). Additionally, there are the mid-cap (S&P 400) and small cap (S&P 600) semiconductor industry indices.
As shown below, whereas the S&P 500’s semiconductor index was up an impressive 48% on the quarter, the SOX blew the doors off, up almost 87%. Likewise, the mid- and small-cap semis outperformed the large cap semis with gains of 63% and 88%, respectively. Of course, index construction and methodology between those proxies on the space differ, but when it comes to the S&P 500 industry group versus the SOX, it was a record gap for any quarter since the second half of 1994.
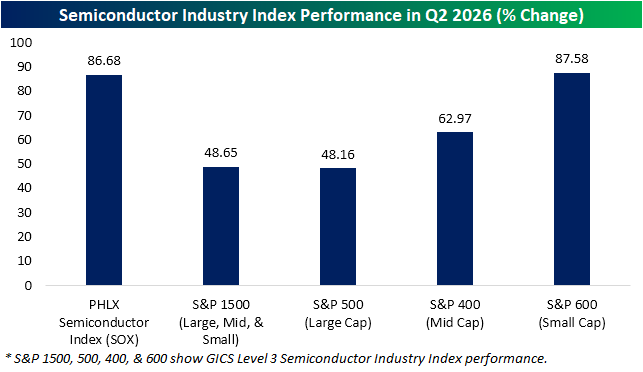
Below we show the quarterly performance of the SOX since 1995 in addition to the performance of the S&P 500, 400, and 600 semi industry indices. Again, it was a record showing for the SOX in Q2. Like the SOX, it was also a record quarter for the semis within the small cap S&P 600 semiconductor index. The mid-cap S&P 400 semiconductors had its second best quarter to date (behind a 75.3% rally in Q4 1997), and the large cap S&P 500 semiconductor industry (which is now the largest industry group by weight), had its best quarter since Q1 2000.
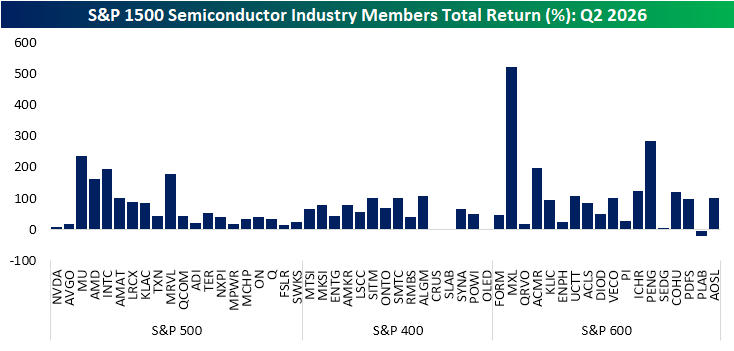
Below, we show the individual quarterly returns of S&P 1500 semiconductor members, sorted from largest to smallest by market cap.
At the top, two of the largest names, Nvidia (NVDA) and Broadcom (AVGO), actually posted some of the smallest returns of the industry in Q2. Granted, the next largest stock and newest member of the trillion dollar market cap club, Micron (MU), was one of the best performing semis. Looking down the list, there were also a couple of huge gainers among the small caps like an astounding 523% gain from Maxlinear (XML) and a 286% rally from Penguin Solutions (PENG). Further, only two were in the red: Universal Display (OLED) and Photronics (PLAB).
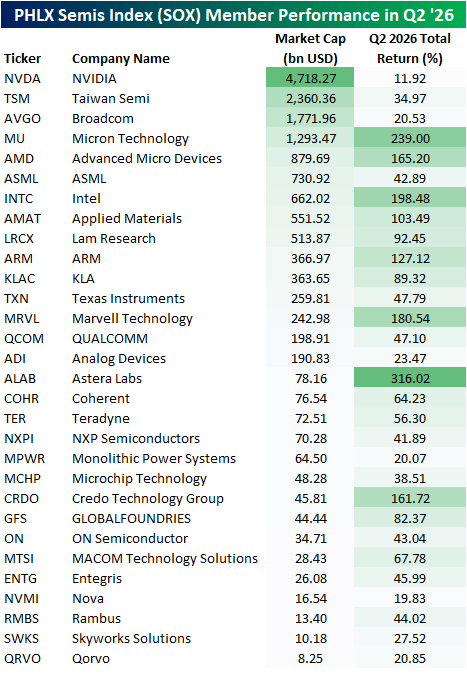
Again, while semiconductor returns in Q2 were good everywhere, at the index level it was a massive gap between the performance of small caps and the SOX versus the S&P 500 or the mid-cap S&P 400. The reason for the gap is multi-faceted. For starters, composition of the indices differs. For example, the SOX, unlike the S&P indices, can include non-US headquartered companies such as Taiwan Semi (TSM) and has no earnings requirements.
Further methodological differences mean the same stock can have different impacts between two indices. As a part of the S&P 500, the S&P 500 Semiconductors index is weighted by pure float-adjusted market capitalization, whereas the SOX applies a tiered cap structure; capping its largest constituent at 12%, the second-largest at 10%, the third-largest at 8%, and all others at 4% with excess weight redistributed to smaller constituents. In other words, the largest stock in both indices (which today is NVDA) has a greater impact on the S&P 500 than it does in the SOX where its impact is dampened due to the cap. NVDA was the single worst performer of SOX members in Q2 with an 11.9% gain. The runner-ups in size, Broadcom (AVGO) and Taiwan Semi (TSM), likewise were underperformers.
The weight cap meant this underperformance was less of a drag on the SOX whereas the uncapped methodology of the S&P 500 resulted in the weaker performance of Nvidia to be more of a factor. Conversely, the smaller market cap stocks with big runs like Astera Labs (ALAB) or Marvell Tech (MRVL) would have smaller impacts on an S&P index and amplified impacts on the SOX.
Want more from Bespoke? You can start by joining our Think BIG mailing list, where you’ll receive an interesting market stat in your inbox a few times per week. All we need is your email address. Join now by clicking here or on the image below.