The Bespoke Interactive Earnings Database allows users to view historical quarterly earnings reports for nearly all U.S. stocks going back to the turn of the century (2001). For each company included in the database, we include the date of the company’s report as well as how it reported relative to analyst expectations. From there, though, we take it to another level. For each date the company reported, we also include the reaction of the stock at the open on its earnings reaction day, then from the open to the close, and finally over the course of the entire day.
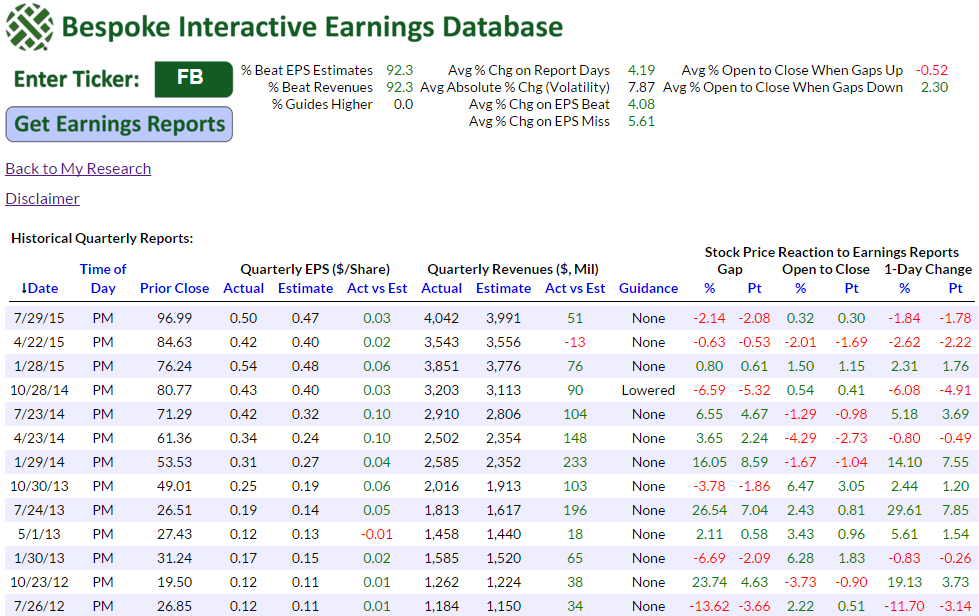
What makes this an extremely useful tool for traders is that it helps uncover trends in the way a company’s stock typically reacts to earnings. In the example below, we have included a snapshot of Facebook (FB) from our database. FB will report earnings after the close today, and as shown in the table, it has only missed bottom line EPS forecasts once in its thirteen quarterly reports since the IPO. Despite the impressive beat rate, however, FB’s stock has only gone up the day after its report seven out of thirteen times. Therefore, one can assume that for FB at least, simply beating bottom line results isn’t always enough.
In addition to the Interactive Earnings Database, Bespoke offers a number of tools to help investors and traders navigate earnings season each quarter. If you are an active investor looking to stay on top of things, you should really consider a free no obligation 10-day trial to our Institutional service in order to unlock the total Bespoke experience. If you are a less active investor and looking for a more affordable option, you also can’t go wrong with our Bespoke Premium or Newsletter offerings.
Sign up for a free trial today! If you apply the coupon code “EARNINGSDATABASE” at checkout, you’ll get 40% off your first payment!