To say that the month of August has seen a pickup in volatility would be an understatement. A perfect illustration is the much more extreme readings we have seen in market breadth. While the S&P 500’s average daily breadth reading has been +/-196 so far in 2019, in the month of August alone, that average reading has rocketed up to +/-330. This indicates that we’re seeing many more days where the vast majority of stocks in the S&P 500 are moving either up or down compared to ‘normal’ days where there is more of an even split between the number of stocks trading up or down on a given day.
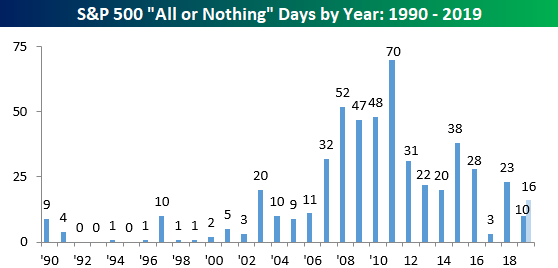
With the big ups and downs in the market on a day to day basis, we have also seen a big uptick in the number of all or nothing days for the market. For those unfamiliar with the term, we consider an “all or nothing day” to be one where the S&P 500’s net daily A/D (advance/decline) reading is greater than +/-400. In the last four trading days alone, there have been three, and so far in August, there have been a total of five. That’s half of the total for all of 2019 so far. As shown in the chart below, though, the pace of all or nothing days this year has been quiet compared to other years since the financial crisis. From a high of 70 in 2011, the current pace for this year is just 16, although as the last few days illustrate, they do tend to come in bunches. In today’s Chart of the Day, we looked at these recent extreme all or nothing days and noted two reasons why they stand out even more and highlight what it potentially means for the market moving forward.
To view the report and see what history suggests going forward, start a two-week free trial to any of our research membership levels.