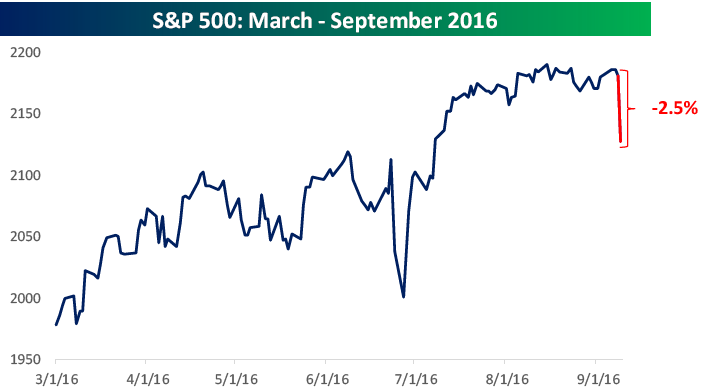
 It was bound to happen at some point. After 43 trading days without one, the S&P 500 finally had a 1% one-day move on Friday, and boy did it ever. Also, true to form and as we noted in our Chart of the Day from August 31st, once we finally got one, it was down. The fact that it has been so long since we have seen a big decline coupled with it coming on a Friday only compounded investor concerns heading into the weekend. A 2% decline in the market is bad enough, but when you have to stew over it for the entire weekend, it only makes things worse. Those fears were on display early this morning, as US equity futures traded sharply lower. While they’re still down as of 9 AM ET, they have significantly cut their losses.
In today’s Chart of the Day, which was sent to paid subscribers, we look at prior 2%+ declines on a Friday and show how the S&P 500 performed on the following trading day and over the following week. See today’s Chart of the Day by starting a 14-day free trial to Bespoke’s premium research below.
