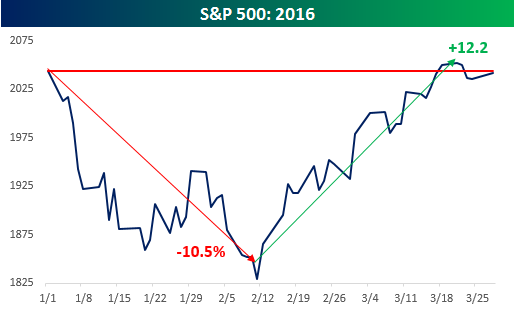
 With just a handful of days left in the quarter, we wanted to take a look back at what has been a crazy three months. As hard as it was to believe that the S&P 500 was down more than 10% on the year on 2/11, it was even more unfathomable that by the end of Q1 the S&P 500 would have erased all of those losses and been flat, or even up, on the year at some point before 3/31.
In today’s Chart of the Day, we went back and looked at prior years where the S&P 500 saw 10% moves to both the upside and downside in the span of the first quarter. We then checked to see how the market did for the remainder of those years. The results are rather impressive!
To read our Chart of the Day, enter your info below and start a free Bespoke research trial. During your trial, you’ll also receive access to our model stock portfolios, daily market alerts, and weekly Bespoke Report newsletter.
[thrive_leads id=’59052′]
