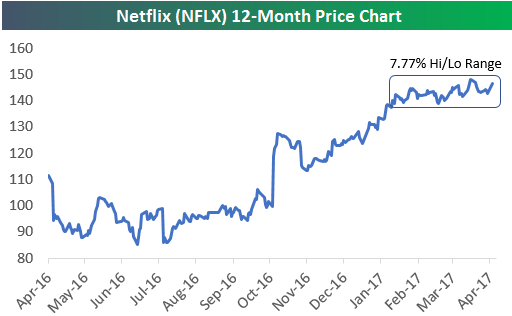
After posting gains of 19% and 4% on its last two earnings reaction days, Netflix (NFLX) is entering its April earnings report (tonight after the close) in what appears to be a hibernation phase. Over the last three months (60 trading days), NFLX has had a high/low closing range of just 7.77%. That’s actually the lowest 3-month high/low range that the stock has ever experienced dating back to its IPO in 2002.
Given the complete lack of volatility for a normally volatile stock, is NFLX set to explode higher or completely tank lower when it opens for trading tomorrow following earnings? It’s definitely likely to experience a big move one way or the other. Over NFLX’s 59 quarterly reports dating back to ‘02, the stock has experienced an average move of +/-13.87% on its earnings reaction days. That ranks it at the very top of large-cap stocks and 13th out of all US stocks in terms of earnings day volatility.
We pulled up NFLX’s historical reports using our Earnings Database (available to Bespoke Institutional and Exclusive members only) to see how the stock typically trades on its April earnings reports. We ended up finding some amazing stats. For a stock that has gained more than 13,000% since its IPO 15 years ago, the stock has actually struggled quite a bit on its earnings reaction days. In today’s Chart of the Day (available to all paid clients), we highlight a few key earnings stats for Netflix. Start a no-obligation two-week free trial to Bespoke’s research platform to see the report now.