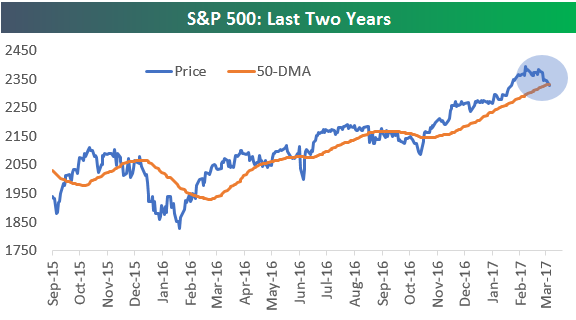
If the S&P 500 closes below ~2,333 today, it will be the first time in 93 trading days that the index closed below its 50-day moving average. Given that price above or below the 50-DMA is seen as a line of demarcation for whether an index is in a short-term up- or down-trend, a close below the 50-DMA will have technicians switching to a more bearish tune.
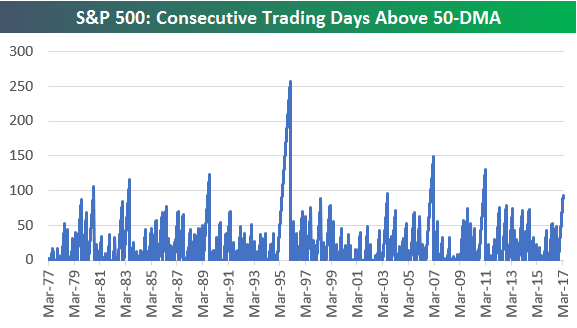
The current streak of 93 trading days above the 50-day is the longest since a 130-trading day stretch that ended in March 2011. Over the last 20 years, this is only the fifth time the index has had a streak of more than 4 months (roughly 88 trading days) above its 50-day, and it’s only the 11th streak of more than 4 months over the last 50 years.
So how has the market historically done when it has broken below its 50-day after trading above it for a long stretch of time like it has just done? We just sent today’s Chart of the Day to Bespoke research subscribers with an answer to this question. The results may surprise you. If you’re not yet a subscriber, you can see the report by starting a 14-day no-obligation free trial below. Please log-in here if you’re already a member.
