Nov 17, 2017
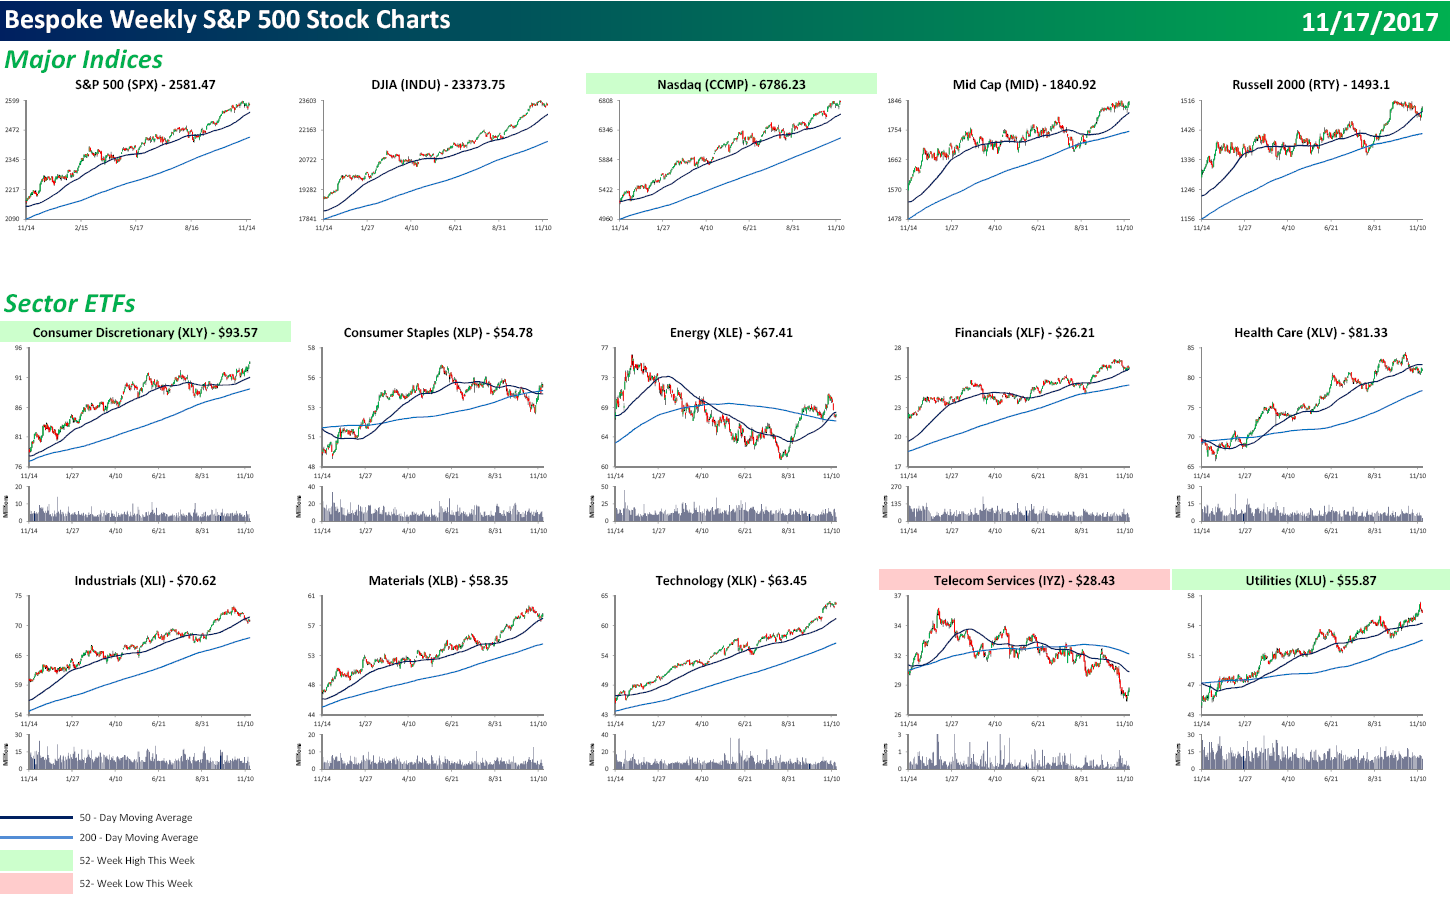
Each weekend as part of our Bespoke Premium and Institutional research service, clients receive our S&P 500 Quick-View Chart Book, which includes one-year price charts of every stock in the S&P 500. You can literally scan through this report in a matter of minutes or hours, but either way, you will come out ahead knowing which stocks, or groups of stocks, are leading and lagging the market. The report is a great resource for both traders and investors alike. Below we show the front page of this week’s report which contains price charts of the major averages and ten major sectors.
As seen in the charts below, the only major average that didn’t hit an all-time high this week was the Russell 2000, but it remains right near its highs with only a small pullback. In terms of individual sectors, we saw new highs from Consumer Discretionary, Financials, and Technology, while Telecom Services (a sector with just three stocks) made a new low.
Make sure to check out our entire S&P 500 Chart Book by signing up for a 14-day free trial to our Bespoke Premium research service.

Nov 10, 2017
This content is for members only
Nov 3, 2017
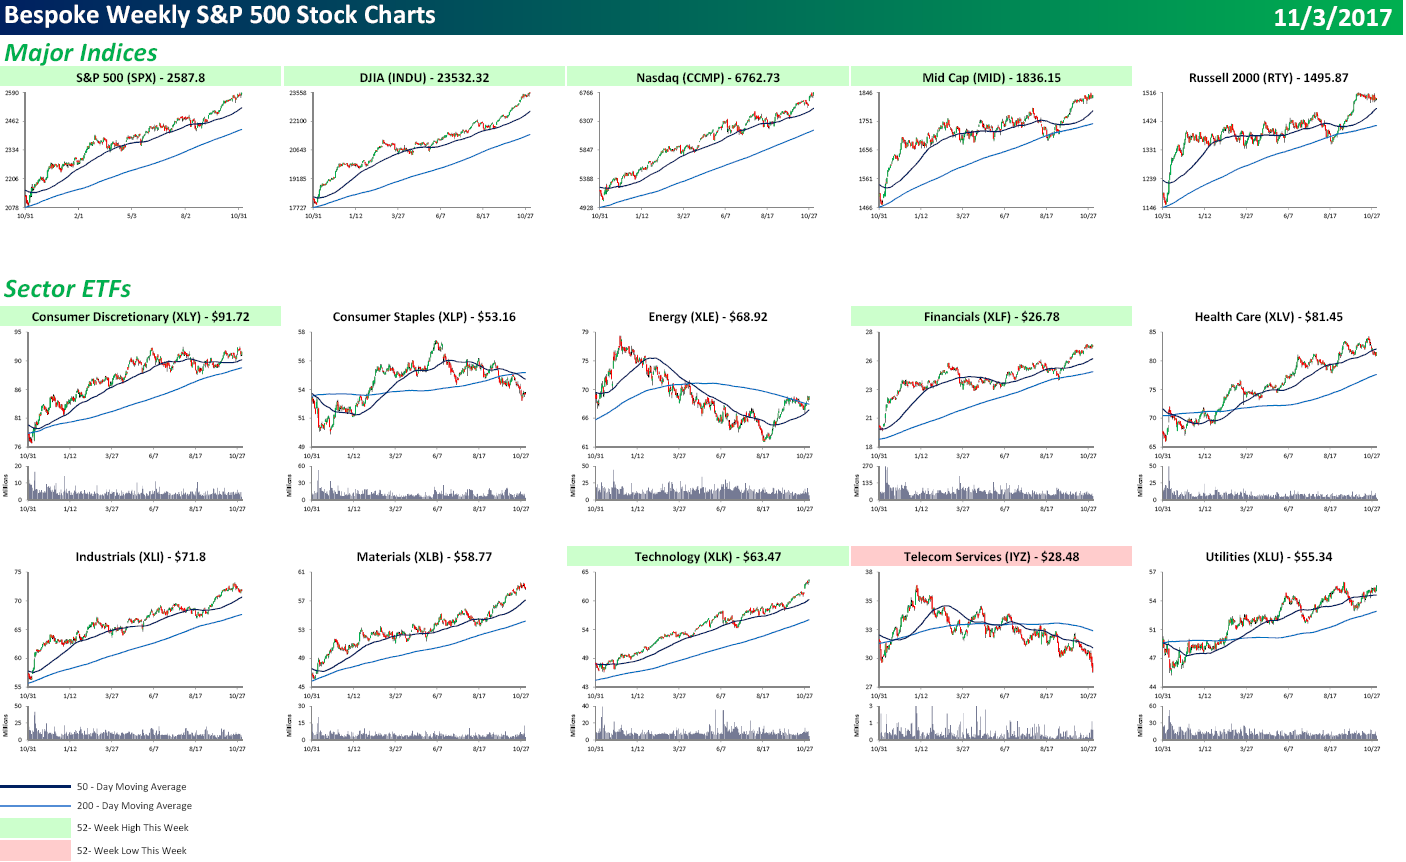
Each weekend as part of our Bespoke Premium and Institutional research service, clients receive our S&P 500 Quick-View Chart Book, which includes one-year price charts of every stock in the S&P 500. You can literally scan through this report in a matter of minutes or hours, but either way, you will come out ahead knowing which stocks, or groups of stocks, are leading and lagging the market. The report is a great resource for both traders and investors alike. Below we show the front page of this week’s report which contains price charts of the major averages and ten major sectors.
As seen in the charts below, the only major average that didn’t hit an all-time high this week was the Russell 2000, but it remains right near its highs with only a small pullback. In terms of individual sectors, we saw new highs from Consumer Discretionary, Financials, and Technology, while Telecom Services (a sector with just three stocks) made a new low.
Make sure to check out our entire S&P 500 Chart Book by signing up for a 14-day free trial to our Bespoke Premium research service.

Oct 27, 2017
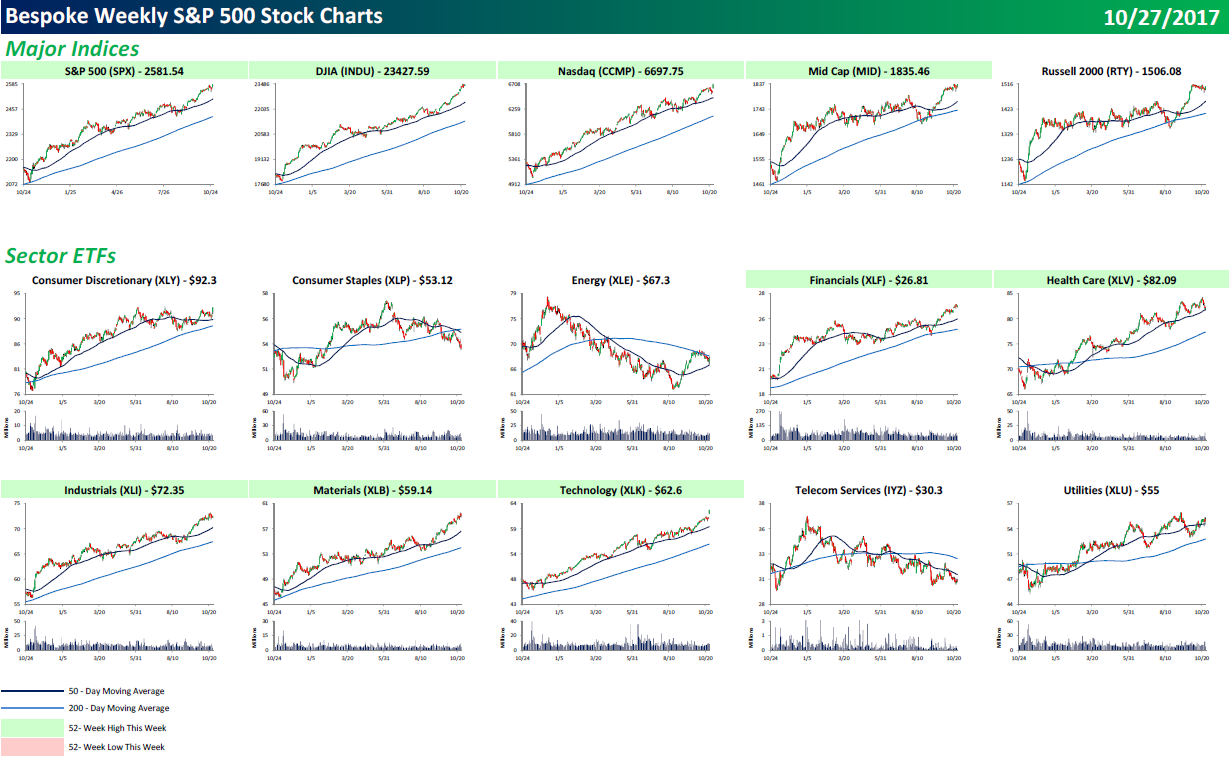
Each weekend as part of our Bespoke Premium and Institutional research service, clients receive our S&P 500 Quick-View Chart Book, which includes one-year price charts of every stock in the S&P 500. You can literally scan through this report in a matter of minutes or hours, but either way, you will come out ahead knowing which stocks, or groups of stocks, are leading and lagging the market. The report is a great resource for both traders and investors alike. Below we show the front page of this week’s report which contains price charts of the major averages and ten major sectors.
As seen in the charts below, the only major average that didn’t hit an all-time high this week was the Russell 2000, but it remains strong as well. In terms of individual sectors,we saw new highs from Financials, Health Care, Industrials, Materials, and Technology. The only cyclical sector that didn’t hit a new high was the brick-and-mortar-plagued Consumer Discretionary sector.
Make sure to check out our entire S&P 500 Chart Book by signing up for a 14-day free trial to our Bespoke Premium research service.
Oct 20, 2017
Each weekend as part of our Bespoke Premium and Institutional research service, clients receive our S&P 500 Quick-View Chart Book, which includes one-year price charts of every stock in the S&P 500. You can literally scan through this report in a matter of minutes or hours, but either way, you will come out ahead knowing which stocks, or groups of stocks, are leading and lagging the market. The report is a great resource for both traders and investors alike. Below, we show the front page of this week’s report which contains price charts of the major averages and ten major sectors.
As seen in the charts below, the only major average that didn’t hit an all-time high this week was the Russell 2000, but it remains at extremely extended levels. In terms of individual sectors, Industrials, Materials, and Technology all hit new highs.
To see this week’s entire S&P 500 Chart Book, sign up for a 14-day free trial to our Bespoke Premium research service.

Oct 13, 2017
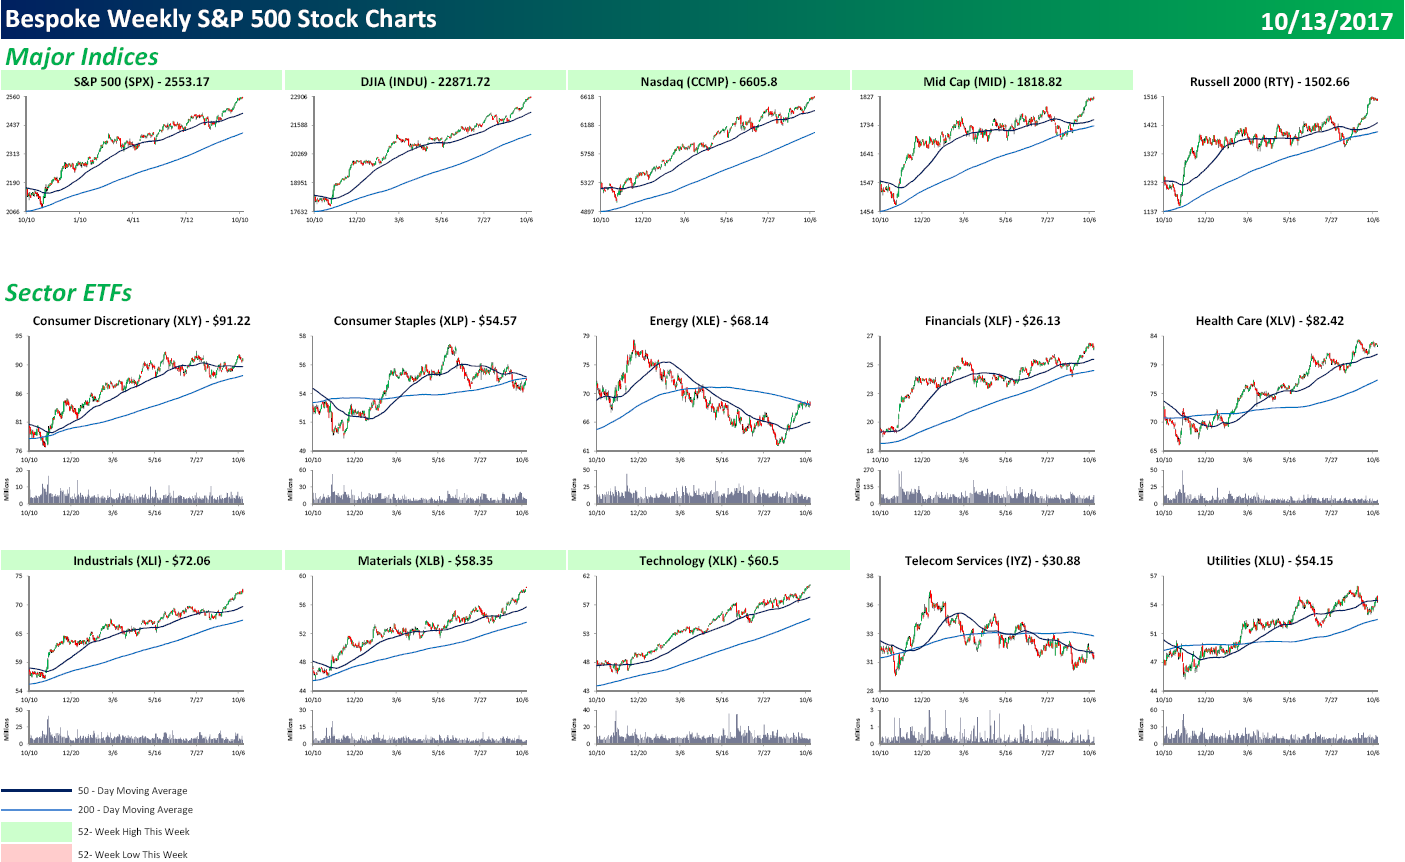
Each weekend as part of our Bespoke Premium and Institutional research service, clients receive our S&P 500 Quick-View Chart Book, which includes one-year price charts of every stock in the S&P 500. You can literally scan through this report in a matter of minutes or hours, but either way, you will come out ahead knowing which stocks, or groups of stocks, are leading and lagging the market. The report is a great resource for both traders and investors alike. Below, we show the front page of this week’s report which contains price charts of the major averages and ten major sectors.
As seen in the charts below, the only major average that didn’t hit an all-time high this week was the Russell 2000, but it remains at extremely extended levels. In terms of individual sectors, Industrials, Materials, and Technology all hit new highs.
To see this week’s entire S&P 500 Chart Book, sign up for a 14-day free trial to our Bespoke Premium research service.