Jul 16, 2026
Log-in here if you’re a member with access to the Closer.
- Netflix (NFLX) earnings showed record operating incomes despite a dive in free cash flow.
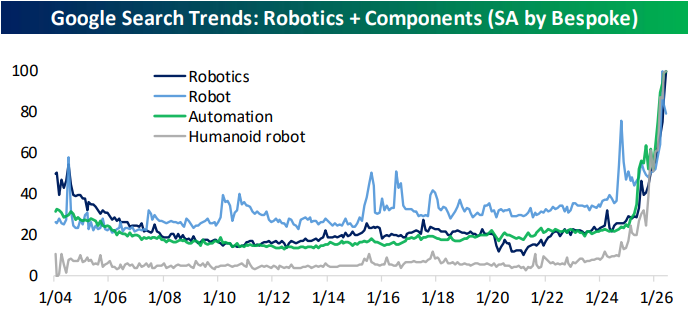
- Robotics appears to be a growing theme with industrial robot orders surging in the past year and Google search interest for related terms rising exponentially.
- Retail sales ex. gasoline has run at a historically strong 10% annualized rate for four of the last five months.
See today’s full post-market Closer and everything else Bespoke publishes by starting a 14-day trial to Bespoke Institutional today!
Jul 16, 2026
Bespoke’s Conference Call Recaps use AI to summarize lengthy earnings calls. The commentary below is AI-generated and then edited by Bespoke for quality control. As always, none of these summaries should be construed as recommendations to buy or sell any securities, and investors should do their own research and/or consult with a financial professional before making any investment decisions.
Our latest recap available to Bespoke subscribers covers Wells Fargo’s (WFC) Q2 2026 earnings call.

Wells Fargo (WFC) is one of the largest US financial institutions, providing consumer and commercial banking, credit cards, auto and mortgage lending, wealth management, investment banking, trading, payments, and treasury services. WFC’s second-quarter results showed strong growth across the bank after years of being restricted by the Federal Reserve’s asset cap. Earnings per share rose 25% to $2, revenue increased 9%, average loans grew 12%, and deposits rose 10%. Management said the decline in net interest margin is largely intentional. WFC is taking on more lower-margin financing and interest-bearing deposits to win more trading, payments, and investment-banking business from those same clients. Consumer credit remains strong, helped by steady employment and wage growth, while businesses are financially healthy but still cautious about hiring and major spending. Investment banking benefited from active M&A and open debt and equity markets. Management also warned that some banks and non-bank lenders are taking more risk, particularly in wholesale lending and the financing of data centers, power infrastructure, chips, and other parts of the AI buildout. Despite EPS and revenue beats, shares fell 2.6% on 7/14…
Continue reading our Conference Call Recap for WFC by becoming a Bespoke Institutional subscriber. You can sign up for Bespoke Institutional now and receive a 14-day trial to read our newest Conference Call Recap. To sign up, choose either the monthly or annual checkout link below:
Bespoke Institutional – Monthly Payment Plan
Bespoke Institutional – Annual Payment Plan
Jul 16, 2026
Bespoke’s Conference Call Recaps use AI to summarize lengthy earnings calls. The commentary below is AI-generated and then edited by Bespoke for quality control. As always, none of these summaries should be construed as recommendations to buy or sell any securities, and investors should do their own research and/or consult with a financial professional before making any investment decisions.
Our latest recap available to Bespoke subscribers covers Citigroup’s (C) Q2 2026 earnings call.
Citigroup (C) is a global financial-services company providing transaction banking, securities services, markets, investment banking, wealth management, and credit cards to corporations, governments, institutions, and consumers. Citi reported its best quarterly revenue in a decade: $24.8 billion, up 14%, with $5.8 billion of net income, $3.15 of EPS, and a 13.0% return on tangible common equity. Services reached record revenue as deposits rose 19% and cross-border transaction value increased 13%; Markets revenue grew 17%, investment banking rose 44%, and equities jumped 45%. Management described corporate clients as resilient despite tariffs, supply-chain shifts, energy shocks, and geopolitical uncertainty, while AI-related spending on data centers, power, semiconductors, and memory continued to drive financing activity. US consumers also remained healthy, with solid spending and lower delinquencies. Citi expects normal second-half seasonality but plans to use constructive conditions to accelerate organic investment, AI automation, restructuring, and long-term productivity gains. Shares fell more than 5% on 7/14 despite the better-than-expected results…
Continue reading our Conference Call Recap for C by becoming a Bespoke Institutional subscriber. You can sign up for Bespoke Institutional now and receive a 14-day trial to read our newest Conference Call Recap. To sign up, choose either the monthly or annual checkout link below:
Bespoke Institutional – Monthly Payment Plan
Bespoke Institutional – Annual Payment Plan
Jul 16, 2026
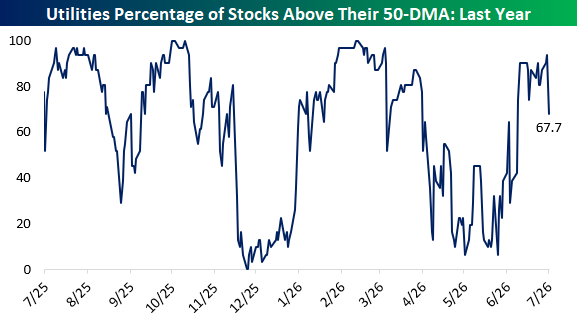
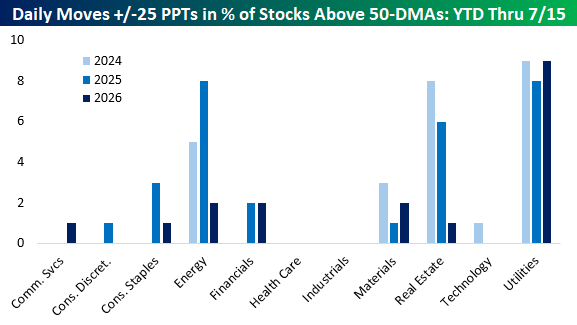
The Utilities sector of the S&P 500 slid 0.98% yesterday, making it the index’s worst-performing sector. Just 5 of 31 member stocks finished higher as the percentage of stocks trading above their 50-DMAs sank from 93.5% to 67.7%, a one-day drop of 25.8 percentage points.
Through July 15th, the Utilities sector has recorded 6 one-day declines of at least 25 percentage points in the percentage of stocks above their 50-DMAs this year. That ties 2010 for the second-most such declines on record through this point last year. Only 2020 and 2025 had more, with 7 days each.
In contrast, swings of the same magnitude in the other direction have occurred just 3 times so far this year. Since the turn of the century, the Utilities sector has averaged two daily improvements and three daily declines of at least 25 percentage points YTD through July 15th. In other words, although sharp breadth improvements have been more common than usual this year, they have still been outnumbered two to one by equally sharp deteriorations, which have been nearly as common as ever.
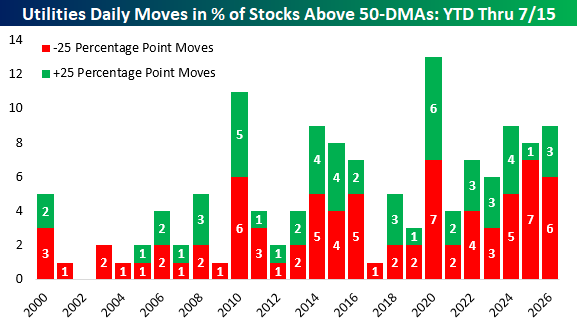
This type of breadth volatility has become a defining feature of Utilities in recent years since the AI boom. In each of the last three years, the sector has either led or tied all other S&P 500 sectors in the number of daily moves of at least 25 percentage points in either direction through July 15th. Energy tied Utilities with eight such moves last year, but no other sector has matched it over that span.
Most sectors outside of Utilities, Energy, Real Estate, and Materials have had at least one year since 2024 with no moves of that magnitude through July 15th. Health Care and Industrials have had none in any of the last three years, compared with 26 combined for Utilities. One partial driver for the high and low frequency of moves among sectors is the number of components in each. Utilities, Energy, and Real Estate all rank in the bottom five in terms of the number of components in each sector.
You can find more sector research like this in Bespoke’s Daily Sector Snapshot.
Read about Bespoke’s premium membership options to find out how to receive our Sector Snapshot in your inbox daily.
Jul 16, 2026
See what’s driving market performance around the world in today’s Morning Lineup. Bespoke’s Morning Lineup is the best way to start your trading day. Read it now by starting a two-week trial to Bespoke Premium. CLICK HERE to learn more and start your trial.
“All you have to do is say something nobody understands and they’ll do practically anything you want them to.” – J.D. Salinger

Bespoke’s Paul Hickey will be appearing on Making Money With Charles Payne today at 2 PM on Fox Business. Check it out!
Below is a snippet of commentary from today’s Morning Lineup. Start a two-week trial to Bespoke Premium to view the full report.
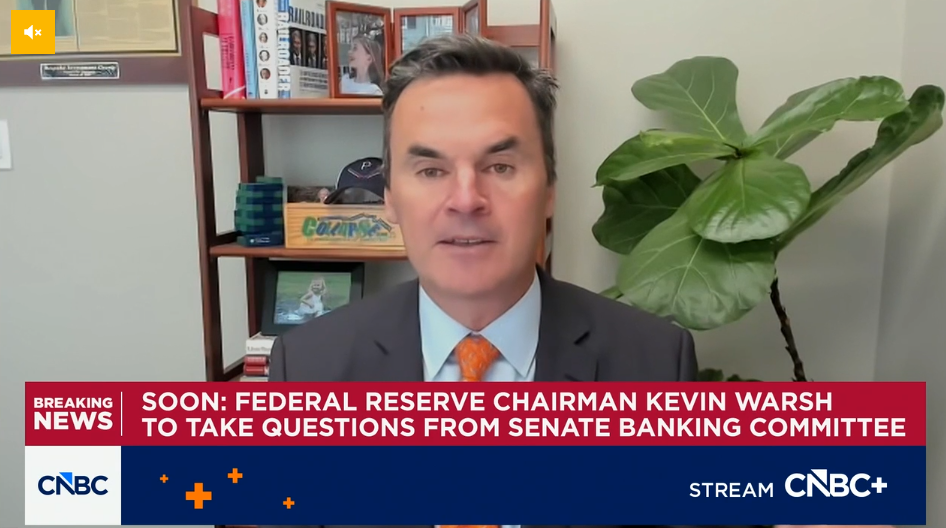
Paul Hickey appeared on CNBC’s Squawk on the Street yesterday to discuss markets and inflation. To view the segment, click on the image below.
Futures were modestly weaker early this morning, but things have taken a turn for the worse as the morning goes on. S&P 500 futures are currently down 0.3% while the Nasdaq is indicated to open nearly 1% lower as investors question the durability of the AI trade. Treasury yields are moving higher, with the 10-year yield up 4 basis points to 4.59%, and crude oil is fractionally higher, trading right around $80 per barrel as President Trump threatens to escalate attacks on Iran. Gold and Bitcoin are both lower by about 1%.
It was a tough night in Asia as the Nikkei plunged nearly 3% and South Korea tanked over 6%. The weakness in South Korea comes as regulators look to crack down on levered ETFs, which have been driving much of the volatility on both the way up and the way down.
European stocks are also lower again this morning, with the STOXX 600 down 0.5% while Germany trades down by nearly a full percent. UK GDP came in modestly better than expected, while Industrial Production and Construction Output both dropped more than expected.
It’s a busy day for data in the US this morning, and just about all of it was better than expected. Initial and continuing jobless claims both came in slightly lower than expected, while Retail Sales were mostly in line with expectations, although May’s numbers were revised slightly higher. The real showstopper of the morning, though, was the Philly Fed report, which came in much better than expected as the headline index surged to 41.4 (highest since November 2021) versus forecasts for a reading of 12.5,
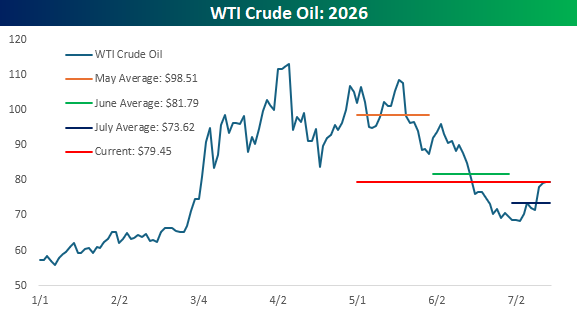
No matter how good the news gets, you can always count on skeptics to show up with a barrage of “buts”. This week’s inflation data from the June CPI and PPI reports both came in lower than expected, easing concerns over the troubling inflation levels from May’s numbers. Before investors could even digest the reports, though, you didn’t have to look far for the rebuttals. Yes, these numbers were good, they said, but with the war in Iran reigniting in the last couple of weeks, oil prices have rallied more than 15% from the early July low, so next month’s numbers will erase the improvement we saw in June.
Inflation is about more than just the price of oil, but since that was the focus of the loudest of the “buts,” let’s look at the trend in prices. During May, crude oil prices averaged $98.51 per barrel. In June, which is the month this week’s data was based on, prices averaged $81.79 per barrel. This morning, after oil prices have “surged” off the July lows, WTI is trading at $79.45 per barrel. That’s still nearly 3% lower than the average price from June, and the average price of $73.62 this month is 10% less than the average price in June. If oil were the only determinant of CPI, we’d be set up for another negative print!
The point here isn’t to diminish the fact that elevated inflation is a long-term issue. We’ll be the last ones to get complacent about the market and inflation, but at current levels, oil prices don’t appear to be a threat to unwind the improvement in CPI that we saw in this week’s data. If the oil price rises back up towards $90 per barrel? Yes, that would be a problem.
Start a two-week trial to Bespoke Premium to continue reading today’s full Morning Lineup.
Jul 16, 2026
Please click here or on the link below to read our latest quarterly Wealth Management Report. You can learn more about Bespoke’s wealth management services available to investors here or by calling our office at 914-315-1248.
Below are links to prior quarterly Wealth Management Reports:
Bespoke WMR Q1 2026
Bespoke WMR Q4 2025
Bespoke WMR Q3 2025
Bespoke WMR Q2 2025
Bespoke WMR Q1 2025
Bespoke WMR Q4 2024