Apr 1, 2026
Log-in here if you’re a member with access to the Closer.
- Short term trends were tested today for the Nasdaq, mega-cap Tech, the VIX, and the dollar.
- The ISM Manufacturing index hit a new high for the cycle with underlying indices rising sharply.
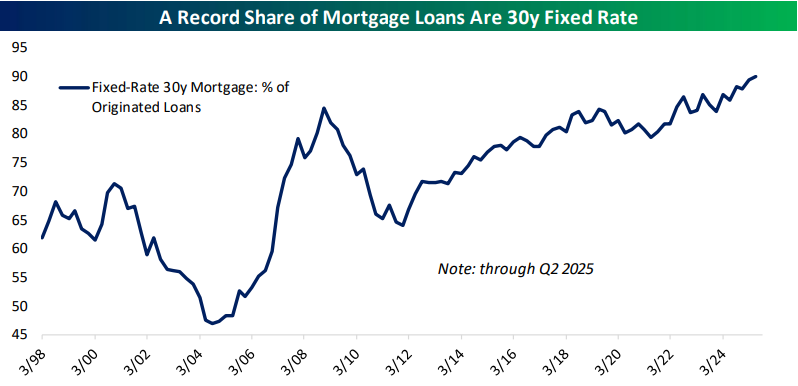
- A record share of home loans are now 30-year fixed rate.
See today’s full post-market Closer and everything else Bespoke publishes by starting a 14-day trial to Bespoke Institutional today!
Apr 1, 2026
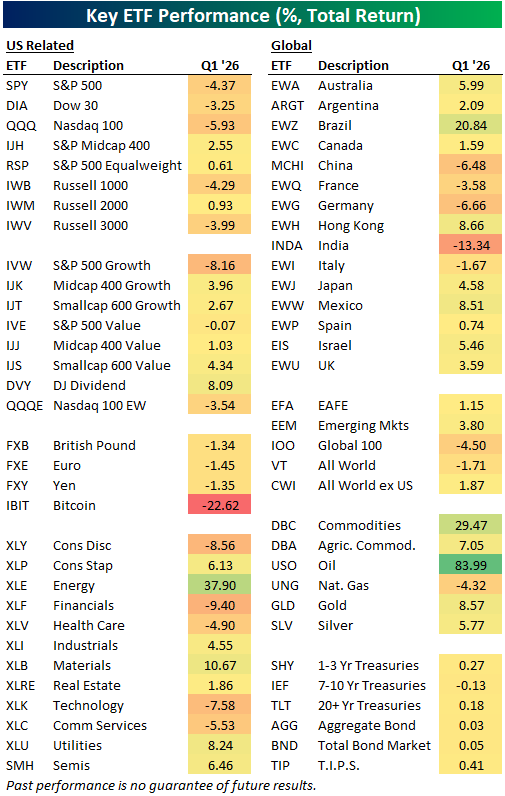
An eventful first quarter is now in the books. In the table below, we show the total return for a range of ETFs across various parts of the equity market (both domestic and international) in addition to other asset classes.
Unsurprisingly, the single largest gain in Q1 came from oil as USO surged 84%. The next best returns were related to oil with the Energy sector (XLE) up 37.9% and broad commodities (DBC) gaining 29.5%. Elsewhere in commodities, gold (GLD) and silver (SLV), in addition to ags (DBA) all rose mid to high single digits. While gold was higher, “digital gold”, or Bitcoin (IBIT), had a rough quarter, falling 22.6%; the worst return of any asset in the matrix.
Turning to equities, the S&P 500 (SPY) fell 4.4%, but the equal weight version of the index (RSP) managed to gain 0.61%. Sector performance was mixed. Again, Energy saw a huge gain as did Materials (XLB), up 10.67%. Other more lightweight sectors like Consumer Staples (XLP), Industrials (XLI), and Real Estate (XLRE) were also higher.
On the downside, some of the more heavyweight areas like Tech (XLK), Consumer Discretionary (XLY), and Financials (XLF) all fell more than 7%. Large caps underperformed small and mid-caps and growth underperformed value. Internationally, most countries saw gains with the largest coming from Brazil (EWZ) as it gained over 20%. Meanwhile, India (INDA) fell the most with a 13.3% drop. China (MCHI), France (EWQ), Germany (EWG), and Italy (EWI) all fell in Q1 as well.
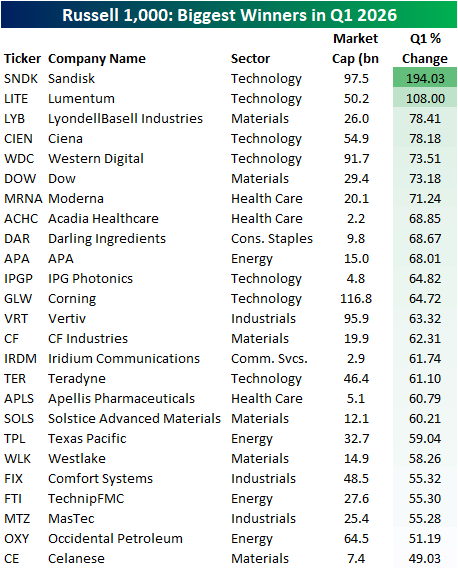
Looking at individual stocks, the Russell 1,000 had less than half of the index move higher in Q1 with the average stock falling 0.29%.
In the table below, we show the 25 top performers in the index during the quarter.
Memory stock Sandisk (SNDK) topped the list with a 194% gain as AI demand continues to bolster that industry. Another AI story that drove a 100%+ gain in Q1 was optical and photonic product manufacturer Lumentum (LITE), who also secured a $2 billion investment from NVIDIA (NVDA) in early March.
A similar name is Ciena (CIEN), which came in at the number four spot with a 78% gain. After the surge in energy prices in March, a number of Energy stocks also top the list like APA (APA), Texas Pacific (TPL), and T TechnipFMC (FTI). Fertilizer manufacturer CF Industries (CF) is also a major winner of the post conflict period, landing it in the best performers with a 32% gain.
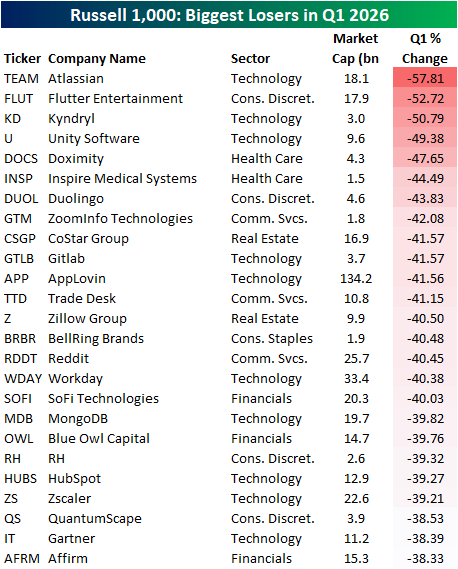
Turning to the quarter’s biggest losers, there were three names that got cut in half: Atlassian (TEAM), Flutter Entertainment (FLUT), and Kyndryl (KD). Two of these are software stocks (TEAM, KD) in the crosshairs of the “AI Doom” trade where investors are worried about business obsolescence, while Flutter owns betting-app FanDuel and is now down 66% from all-time highs made last August.
Like this analysis? Join our premium members by starting a trial today! Click below for details on how to sign up:

Apr 1, 2026
See what’s driving market performance around the world in today’s Morning Lineup. Bespoke’s Morning Lineup is the best way to start your trading day. Read it now by starting a two-week trial to Bespoke Premium. CLICK HERE to learn more and start your trial.
“I felt that if I stayed with them I would probably end up being the richest man in the cemetery.” – Ron Wayne, Co-Founder, Apple (AAPL)

Below is a snippet of commentary from today’s Morning Lineup. Start a two-week trial to Bespoke Premium to view the full report.
Wait, is this some upside follow-through the market is seeing this morning? Equity futures are firmly higher this morning as the S&P 500 is indicated to open 0.9% higher, while the Nasdaq is up over 1%. Treasury yields are lower, with the 10-year yield down below 4.3%, while crude oil is down 3% to $98.5 per barrel. Brent crude, more sensitive to Iran events, is also down 2.5% to $101.4. That price is way below the levels it was quoted at yesterday, but that’s because the contract rolled overnight. Gold prices are up 2.5% to more than $2,760 per ounce, and Bitcoin is up over 1%. If these levels can hold into the end of the trading day, bulls will likely start to feel a bit more emboldened.
What a night the markets had in Asia. Markets in the region were sharply higher with the Nikkei surging 5.2%, and if you think that was impressive, look at the 8.4% rally in South Korea! Besides rebounding on the overall global relief rally on signs of a potential withdrawal from Iran, officials in South Korea noted that the country has ample supplies of helium and ethylene to last through the first half of the year. PMI Manufacturing reports for the region all remained in contraction territory, suggesting that the region’s economy is withstanding the impacts of the Iran war for now.
European markets were mostly closed when markets surged higher yesterday afternoon, so they played catch-up today. The STOXX 600 is up over 2%, as is the case with every regional market, including Italy and Spain, which are both up over 3%. Here again, PMI Manufacturing indices for the region were mostly positive, with Spain being the only notable laggard as it dipped into contraction territory.
Turning back to the US, it’s a busy morning for economic data with ADP Employment (higher than expected: 62K vs 40K forecast), Retail Sales (better than expected), Manufacturing PMIs, and Business Inventories all on the calendar. Besides those releases, we’ll also hear from a few Fed speakers and get auto sales for March throughout the day.
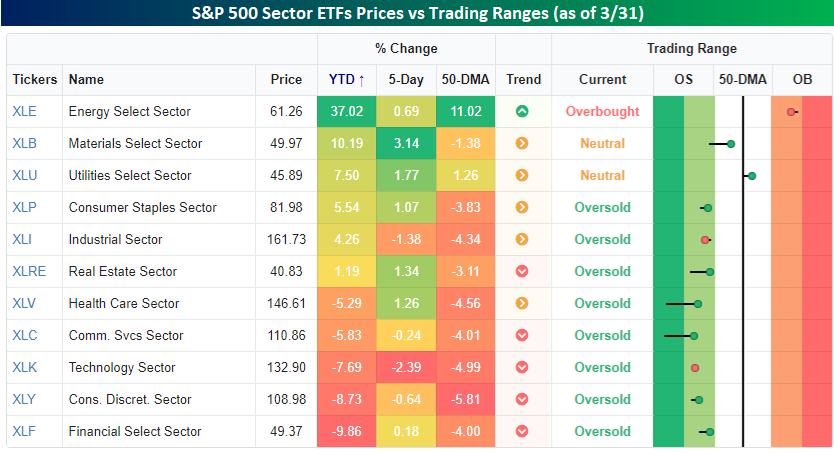
2026 is now behind us, and already it’s been an eventful year for the world and the markets. Our focus here is on markets, so we’ll start with what’s going on in the US, and specifically the S&P 500. The snapshot below from our Trend Analyzer shows the performance of the eleven different sector ETFs during Q1 and where they closed relative to their trading ranges.
Starting with performance, it has been one of, if not the widest, performance gaps between the top and bottom performing sectors in Q1 that we can remember. Topping the list, Energy (XLE) has rallied more than 37% this year, while Financials (XLF) is down just under 10%. While the S&P 500 is down more than 4% this week, just over half of all sectors finished higher in Q1, while five declined. Interestingly or unfortunately, depending on your perspective, all the sectors that are lower YTD have declined at least 5%. At the other end of the spectrum, four of the six sectors that are higher YTD are up more than 5%. The only two sectors that haven’t rallied or declined more than 5% are Industrials (XLI) and Real Estate (XLRE). Talk about the haves versus the have-nots!
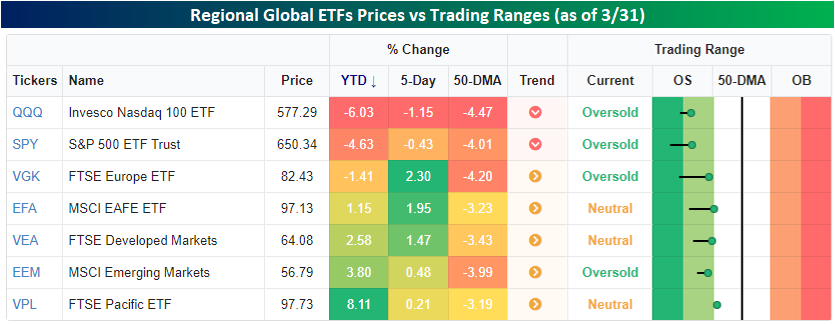
Looking out across the world, US stocks have outperformed their global peers since the war started at the end of February, but on a YTD basis, global stocks have still outperformed. As shown below, the Nasdaq 100 (QQQ) and S&P 500 (SPY) finished the first quarter down 6.03% and 4.63%, respectively, while most other regional ETFs are all higher, except Europe (VGK), which is down just 1.41%. Regardless of the paths they have taken in the first three months of the year, they all finished Q1 in either oversold territory or just barely outside of it.
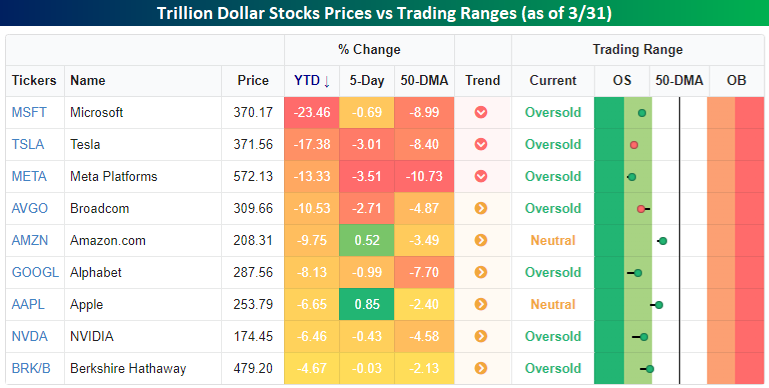
Finally, a newsflash. Remember the days when the mega-caps traded as a monolith in terms of their outperformance relative to the rest of the world? In 2025, the correlation between the trillion-dollar stocks started to break down as they went their separate ways. In Q1, the mega-caps returned to more of a positive correlation in that they all underperformed the S&P 500 in the quarter. While the degree of underperformance varied widely, the fact that all nine of these stocks, which account for nearly 40% of the entire index, suggests that the other 491 have done just fine. In fact, they finished the quarter with an average gain of 1.02%!
Mar 31, 2026
Log-in here if you’re a member with access to the Closer.
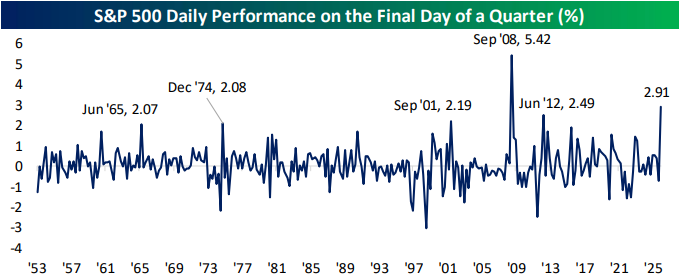
- The S&P 500’s 2.91% rally today was the second strongest close to a quarter since 1953.
- Hires fell out in the latest JOLTS data as it made a new low dating back 10+ years if we exclude the COVID Crash.
- Conference Board data indicated inflation expectations are ramping back up again, showing over 5%.
See today’s full post-market Closer and everything else Bespoke publishes by starting a 14-day trial to Bespoke Institutional today!
Mar 31, 2026
A year ago at this time, consumers were just starting to get relief from a record spike in egg prices caused by a bird flu that tore through the hen population. Ground beef prices were also elevated at more than $5.50/lb. While egg prices collapsed back down to earth, beef prices have continued to tick higher up to $6.73/lb. At this point, the backyard burger is becoming a delicacy. Make sure to enjoy every bite this summer!
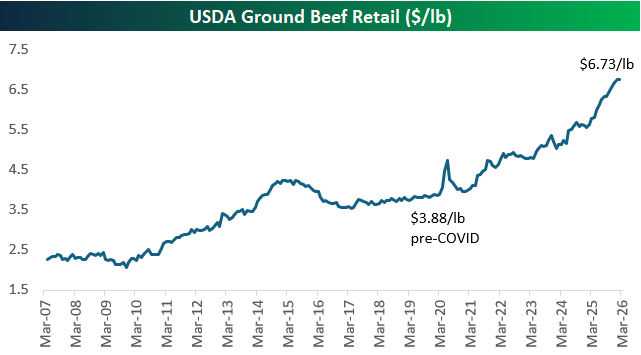
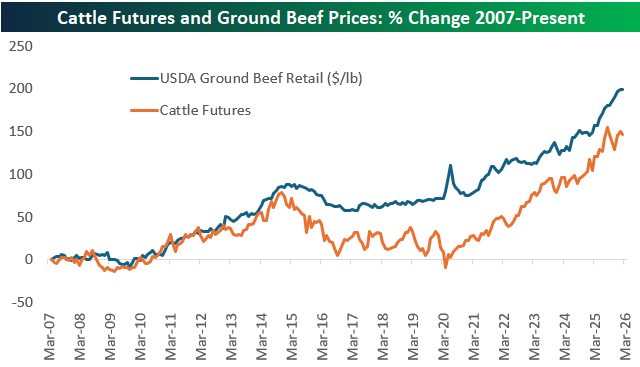
Below is a look at the percentage change in both cattle futures and ground beef prices since 2007 (as far back as we have data for both). The two have tracked each other closely over time, although we saw less of a decline in ground beef in the 2010s when cattle futures fell quite a bit.
While cattle futures saw their last record high in August, that has yet to translate to any relief at the butcher counter.
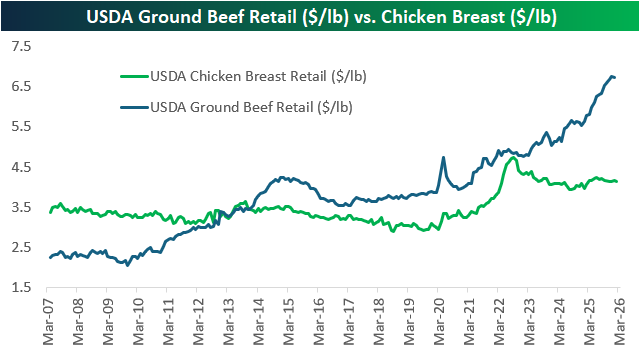
Up until the early 2010s, ground beef was the cheaper protein option than chicken. That relationship certainly doesn’t apply any longer, with ground beef costing 60% more than chicken breast. Since spiking above $4.50/lb in 2022 as inflation raged throughout the economy, chicken breast prices have pulled back some and remained stable in the low-$4 range.
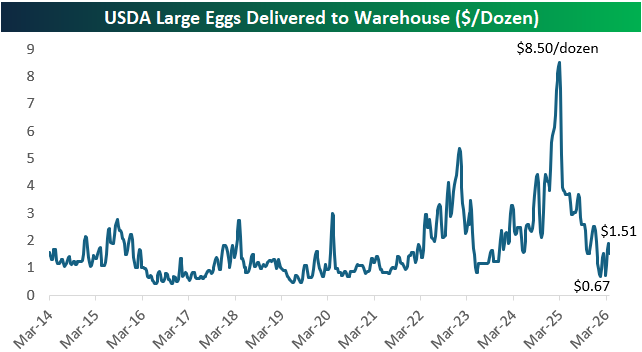
Getting back to egg prices, below is an updated look at the national price for a dozen large eggs delivered to warehouses. After spiking to a record $8.50/dozen in late February last year, prices plunged to as low as $0.67/dozen this January! Prices have more than doubled off those lows back up to $1.51/dozen, but current levels still look extremely cheap compared to what consumers experienced a year ago.
Like this analysis? Join our premium members with our March Madness special! Click below for details on how to sign up:

Mar 31, 2026
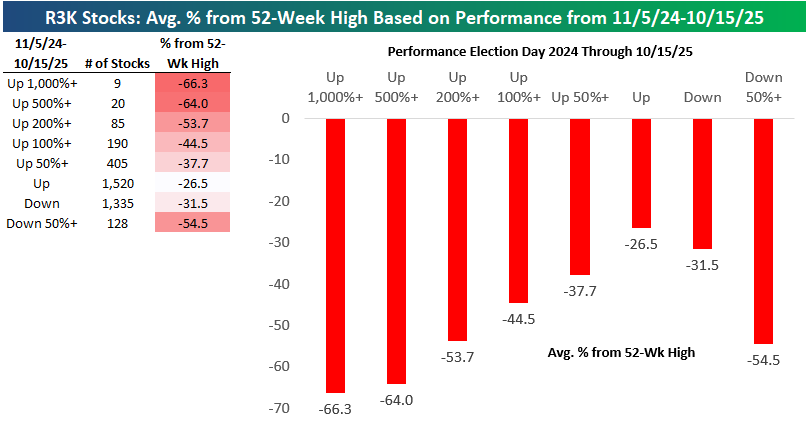
The stock market saw its ups and downs in the first year of Trump 2.0, but some areas of the market went parabolic. Stocks related to quantum computing, robotics, crypto, space, rare earths, small modular reactors, and more saw triple and even quadruple-digit percentage gains in the span of months at various points between November 2024 and October 2025.
In the last five months, the fun has ended for the former high fliers, with most of them down at least 50% from their highs. The peak for the high fliers came on 10/15/25, about two weeks before the Nasdaq 100 made its last all-time high.
Below, we break down the carnage.
In the Russell 3,000, which includes more than 98% of publicly traded market cap in the US, there were 190 stocks that at least doubled from Election Day 2024 through October 15th, 2025. These 190 stocks are currently down an average of 44.5% from 52-week highs.
85 stocks gained more than 200% over the same period, and they’re down an average of 53.7%.
Narrowing down the list even more, there were 20 stocks up 500%+ that are down 64% from 52-week highs, and the 9 stocks that were up 1,000%+ have been cut an average of two-thirds.
Below is a list of the stocks that gained the most from Election Day 2024 through 10/15/25, along with how much they’re currently down from 52-week highs.
Remember the quantum computing stocks like Rigetti (RGTI) and D-Wave (QBTS) that were up more than 4,000% at their highs? They’ve both fallen more than 70%. Or how about Microvast (MVST), the EV battery play that surged over 3,100% only to crater 80% from its peak? Even Chaince Digital (CD), the crypto/blockchain name that exploded 1,125%, has since lost nearly 89% from its high, making it one of the biggest peak-to-trough collapses on the entire list.
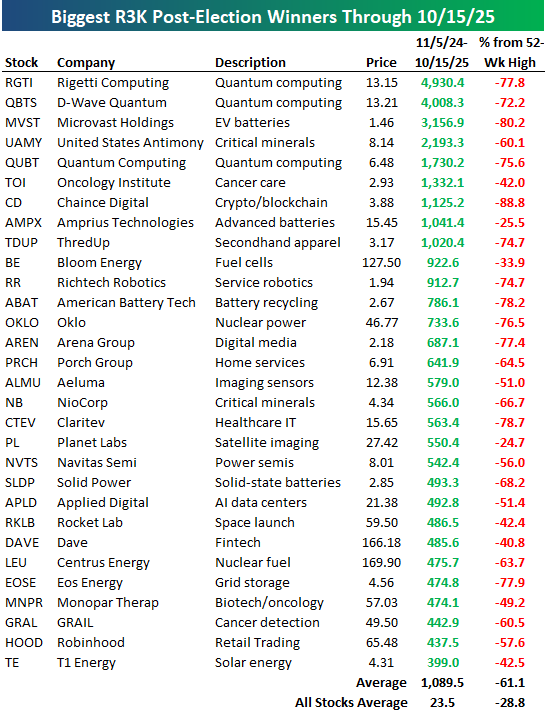
The theme here is painfully consistent. Nearly every name that went parabolic post-election has given back a huge chunk. Nuclear power play Oklo (OKLO) gained 733% but is off 76%. Bloom Energy (BE) was up 922% and has since dropped 34%, one of the more resilient names on the list. Even Rocket Lab (RKLB) and Planet Labs (PL) are down 42% and 25%, respectively, from their highs.
The average gain for these stocks from Election Day through October 15th was a staggering 1,089%, yet the average decline from 52-week highs sits at 61%.
Once again, this is a stark reminder that the higher they fly, the harder they tend to fall!
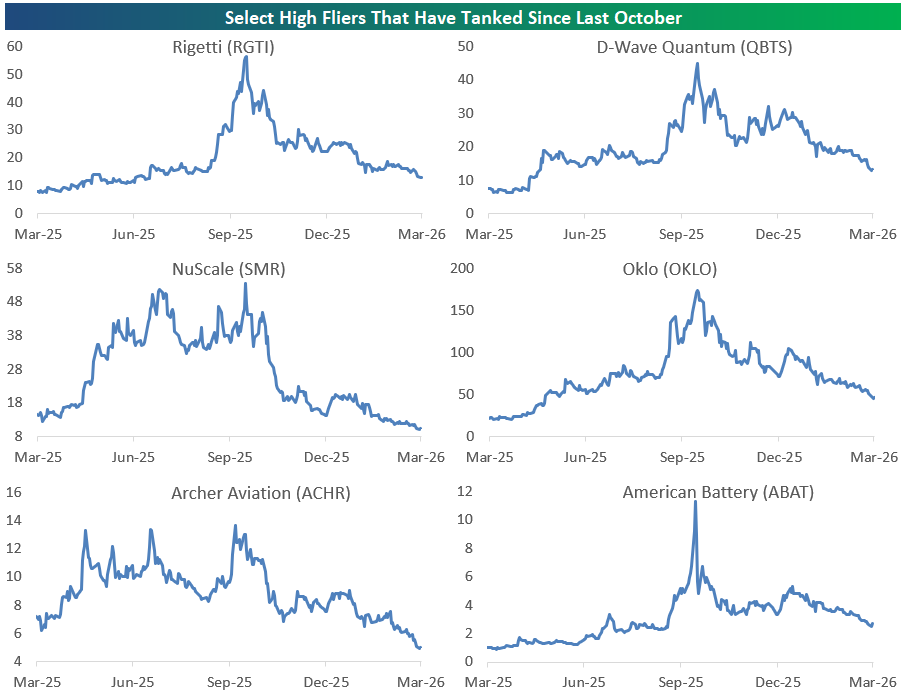
Below are one-year price charts of six select high-fliers to help you visualize the parabolic moves and subsequent plunge.
The broader lesson here is one the market teaches every generation of new traders: parabolic moves may be thrilling to watch but can be treacherous to chase.
Like this analysis? Join our premium members with our March Madness special! Click below for details on how to sign up: