Sep 4, 2025
See what’s driving market performance around the world in today’s Morning Lineup. Bespoke’s Morning Lineup is the best way to start your trading day. Read it now by starting a two-week trial to Bespoke Premium. CLICK HERE to learn more and start your trial.
“If you fail to prepare, you’re prepared to fail.” – Mark Spitz

Below is a snippet of commentary from today’s Morning Lineup. Start a two-week trial to Bespoke Premium to view the full report.
Equity futures are skewed to the upside as yields rise, but a weaker-than-expected ADP Employment report at 8:15 has put a modest damper on the tone in equities. The 8:30 batch of data showed that Unit Labor Costs were weaker than expected, while Non-Farm Productivity came in better than expected. Jobless claims were mixed, with initial claims rising slightly while continuing claims saw a modest decline.
In Asia, most equity indices in the region were higher, with Japan leading the way (+1.5%), but China bucked the trend and traded lower on reports that the government is considering restrictions on stock trading to reduce speculation. European equities are also higher this morning, with France being the exception, following a sharp decline in shares of Sanofi.
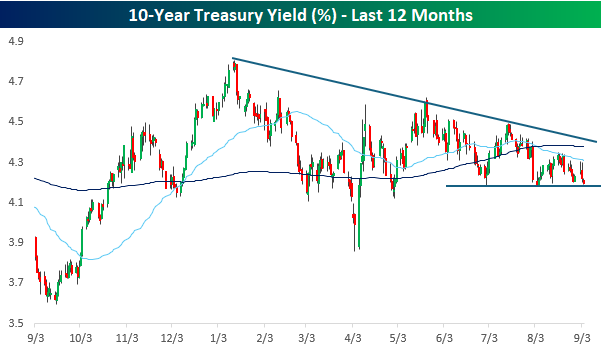
As concerns over an uptick in inflation continue to simmer (even as employment slows), raising questions about how much the Fed will realistically be able to cut rates, the yield on the 10-year US Treasury doesn’t seem overly worried. Since peaking early in the year at just over 4.8%, yields have been steadily trending lower with a series of lower highs since Spring. During this period, there has been a floor at the 4.20% level, but this morning that level is being tested again as the yield briefly moved below 4.2%.
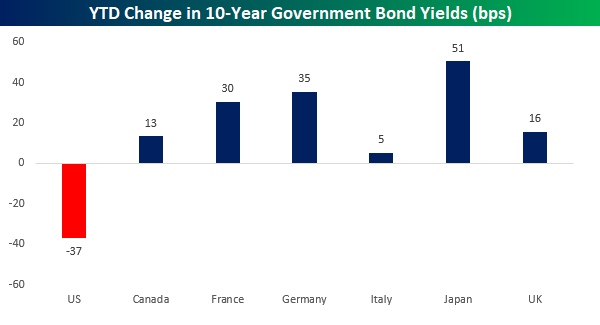
The drop in yields has also occurred against a backdrop of chatter over whether global investors were looking to exit US assets. In global fixed income markets, that doesn’t appear to be the case. While the 10-year yield has declined 37 basis points (bps) YTD, the sovereign 10-year yield of every other G7 country has increased anywhere from 5 bps in Italy to 51 bps in Japan.
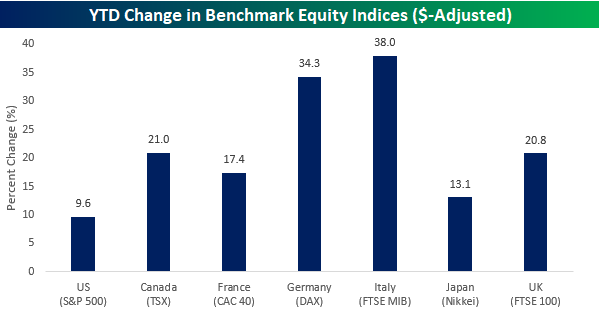
In global equity markets, US exceptionalism hasn’t been as evident. While the S&P 500 is up 9.6% YTD, the benchmark equity index of every other G7 country is up by a larger amount. Japan is the closest in terms of performance to the US (+13.1%) while Italy and Germany are both up over 30%!
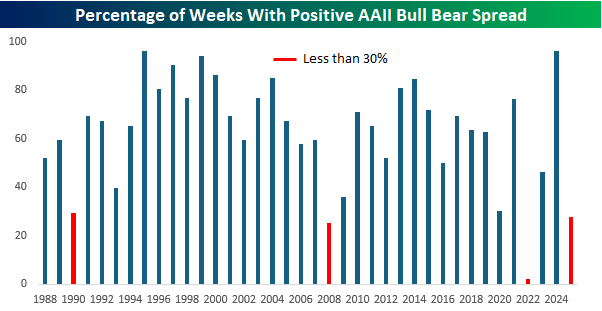
While US equities entered September right near all-time highs with healthy gains for the year, investor sentiment remains skeptical. The latest sentiment survey from the American Association of Individual Investors (AAII) showed a decline in bullish sentiment to 32.7% while bearish sentiment increased to 43.4%. The results pushed the bull-bear spread further into negative territory, marking the fifth straight week that bears outnumbered bulls in what has been a relatively consistent trend of negative sentiment this year.
The chart below shows the percentage of weeks by year when the weekly AAII survey had a positive bull-bear spread. So far this year, the spread has been positive just 28% of the time, which stands in stark contrast to last year, when the bull-bear spread was positive 96% of the time, tied only with 1995 for the most ever in a year. If the current pace of negative readings continues, it will be just the fourth year that the bull-bear spread was positive less than 30% of the time, with the only other years being 1990, 2008, and 2022. It’s understandable to see negative sentiment in bear market/recessionary environments like 1990, 2008, and 2022, but what’s the excuse this year?
Sep 3, 2025
See what’s driving market performance around the world in today’s Morning Lineup. Bespoke’s Morning Lineup is the best way to start your trading day. Read it now by starting a two-week trial to Bespoke Premium. CLICK HERE to learn more and start your trial.
“Not only strike while the iron is hot, but make it hot by striking.” – Oliver Cromwell
Below is a snippet of commentary from today’s Morning Lineup. Start a two-week trial to Bespoke Premium to view the full report.
September may have started on a poor footing. Still, after a bounce yesterday afternoon, the positive tone carried over overnight and into this morning, following positive news for Alphabet (GOOGL) and, by extension, Apple (AAPL). Asian stocks were mostly lower overnight, with the Nikkei falling nearly 1% and China falling more than a percent. In Europe, though, there has been broad-based strength with the STOXX 600 trading up over 0.6%. On the economic calendar today, the only reports on the calendar are JOLTS and Factory Orders.
Yesterday was an unsurprising start to September, and the silver lining was that the ‘buy the dip’ mentality of investors that we discussed in Friday’s Bespoke Report remained intact. The S&P 500 sold off sharply early in the session, tested those lows right around midday, and then rallied throughout the session to finish right at the highs for the day. From a short-term perspective, the S&P 500 has now made two higher highs and two higher lows, reinforcing the overall upward trend.
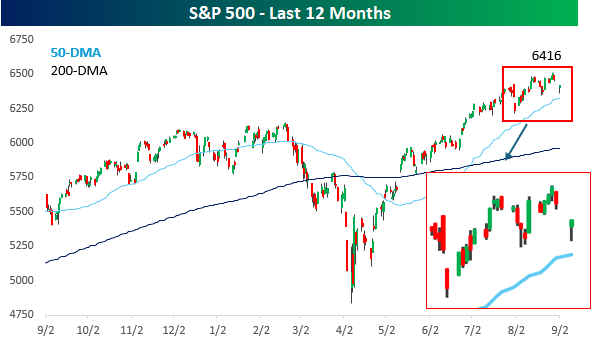
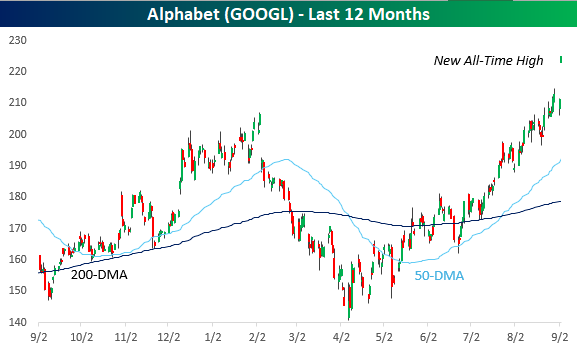
Both the S&P 500 and Nasdaq are priced to continue yesterday afternoon’s bounce this morning, and the key driver is Alphabet (GOOGL) following last night’s ruling that it would not be required to sell its Chrome browser. In response, the stock is on pace to gap up nearly 6%. If these levels hold through the opening bell, it would be the largest upside non-earnings related gap higher since 2008.
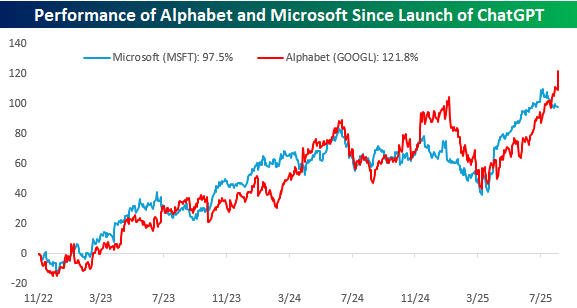
With today’s gain, we also wanted to provide an update on the comparison between GOOGL and Microsoft (MSFT) since the launch of ChatGPT. The overall consensus has been that MSFT’s quick action and investments into OpenAI helped it to win the AI race among the hyperscalers, but the market has a different opinion. While MSFT has nearly doubled since the launch of ChatGPT in November 2022, at the open today, GOOGL will be up over 121%. While MSFT has won in the court of public opinion, GOOGL has won in the wallet.
Sep 2, 2025
See what’s driving market performance around the world in today’s Morning Lineup. Bespoke’s Morning Lineup is the best way to start your trading day. Read it now by starting a two-week trial to Bespoke Premium. CLICK HERE to learn more and start your trial.
“I was never part of the crowd.” – Jimmy Connors
Below is a snippet of commentary from today’s Morning Lineup. Start a two-week trial to Bespoke Premium to view the full report.
After four summer months when the S&P 500 gained at least 1.9%, September is starting on a characteristically weak note as futures are pointing to a decline of 0.7% to kick off the month. As detailed in this morning’s commentary, there’s nothing in the way of a major catalyst to speak of besides an uptick in treasury yields around the world. Gold and oil prices are also higher. The only economic reports on the calendar are the ISM Manufacturing for August and July Construction Spending. The ISM report is expected to come in below 50 again but show an uptick from last month’s weaker-than-expected reading of 48.0 to 48.9 this month. Construction spending is expected to show a modest uptick of 0.1% after declining 0.4% in June.
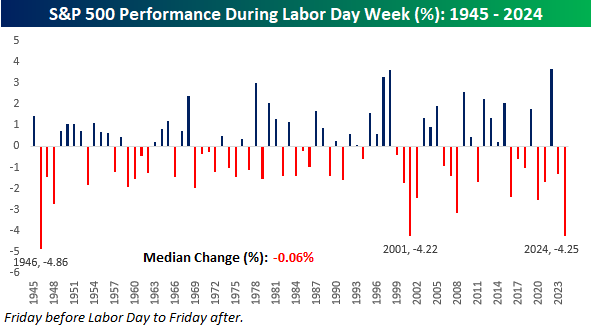
Historically, Labor Day week has been somewhat weak. Since 1945, the S&P 500’s median performance during Labor Day week has been a decline of 0.06% with gains just half of the time. Ironically, last year’s 4.25% decline was the weakest since 1946 and just the third time since 1945 that the index declined 4% or more during the week.
In terms of what that weakness means for the rest of the year, it doesn’t really mean anything. Last year, the S&P 500 rallied 4.13% through year-end after the 4.25% decline. In 2001, it rallied 1.28% for the rest of the year, and in 1946, it fell 8.11%. For all years since 1945, the S&P 500’s median performance from the end of Labor Day week through year-end has been a gain of 3.78% with gains 73% of the time.
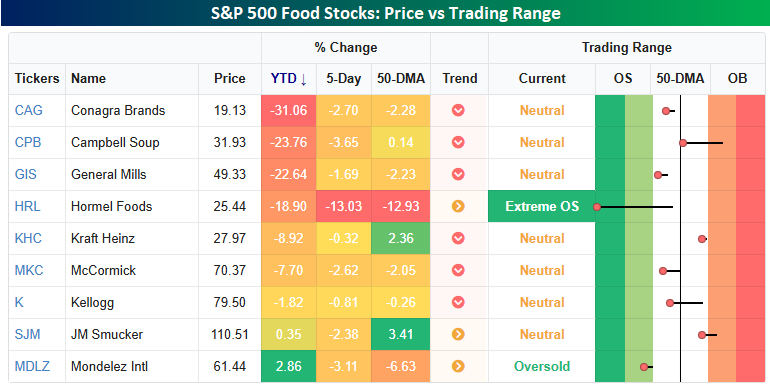
One of the bigger individual stock stories this morning is the announcement that Kraft Heinz (KHC) will split itself into two companies in an effort to boost growth. As the graphic below shows, KHC and its peers could use all the help they can get. The snapshot below from our Trend Analyzer shows where KHC and its peer stocks are trading relative to their trading ranges. On a YTD basis, just two of the nine stocks listed are up on the year, and four of them are down by double-digit percentages. KHC isn’t quite down 10%, but it was before Friday’s news of the breakup originally broke. Last week was particularly poor for the group as well, with all nine trading down anywhere between 13% for Hormel (HRL) to a fractional decline for KHC.
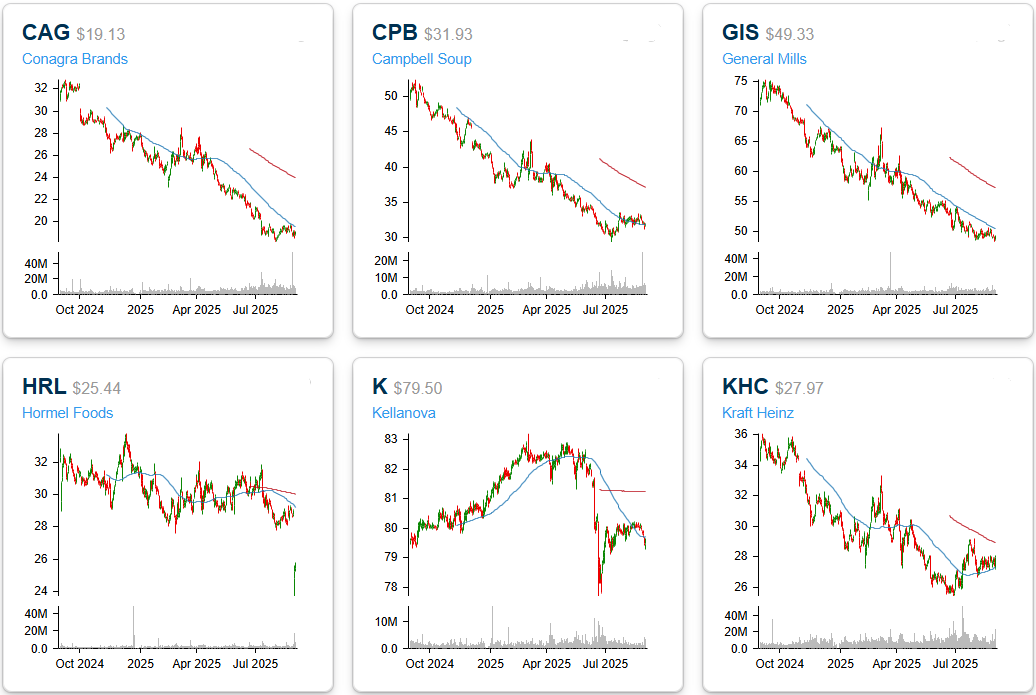
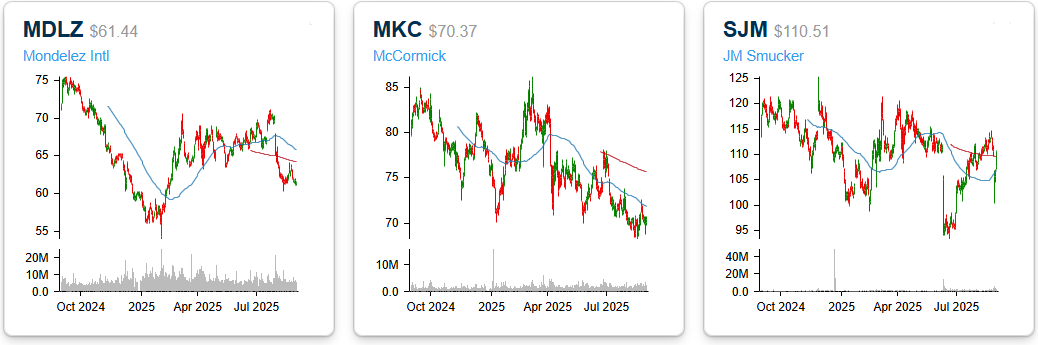
If you have a weak stomach, you may want to skip the section below, which shows one-year price charts of the nine stocks listed above. Practically every single one of them has the same pattern – top left to bottom right. These are the types of charts you would expect to see during a bear market rather than after one of the strongest 100-day market rallies in history!
Aug 29, 2025
See what’s driving market performance around the world in today’s Morning Lineup. Bespoke’s Morning Lineup is the best way to start your trading day. Read it now by starting a two-week trial to Bespoke Premium. CLICK HERE to learn more and start your trial.
“Happiness is good health and a bad memory.” – Ingrid Bergman
Below is a snippet of commentary from today’s Morning Lineup. Start a two-week trial to Bespoke Premium to view the full report.
It’s all over. With Labor Day falling as early on the calendar as it possibly can, today marks the unofficial last trading day of Summer. Not surprisingly, futures are glum. The S&P 500 is indicated to open 0.3% lower, while Nasdaq futures are down by a more substantial 0.5%. The 10-year yield is trading modestly higher (less than 2bps), and the 4.22% yield is near the lowest level since April. Crude oil is fractionally lower, while natural gas is modestly higher. Gold is seeing modest losses, but cryptocurrencies are down by larger amounts, with Bitcoin down 2% and trading under $110K while Ethereum is down closer to 3% and trading below $4,350.
It may be the last summer Friday of the year, but the economic calendar is packed with data. Starting at 8:30, we’ll get Personal Income and Spending along with PCE and Wholesale Inventories. At 9:45, we’ll get the August Chicago PMI, which is expected to come in at 46.5, and that would be a modest downtick from July’s reading of 47.1. Finally, consumer sentiment from UMich will hit the tape at 10 AM. After a weaker-than-expected preliminary reading on 8/15, the headline reading is expected to remain unchanged at 58.6.
In Asia, the Nikkei was fractionally lower but finished the week higher. Japanese economic data was weak, with both Retail Sales and Industrial Production coming in significantly weaker than expected. While the weakness in those reports was disappointing, Tokyo CPI also came in lower than expected, which was positive. In China, shares of Alibaba (BABA) are higher following reports that the company is rolling out AI chips designed to fill the void left by the ban on Nvidia (NVDA) exports to the country.
Like the picture for US futures, European equities are also firmly lower as the STOXX 600 is trading down 0.5% taking its week-to-date decline to 2%. Country-specific equity benchmarks are also down across the board by similar amounts, although Spain is seeing outsized losses with a decline of over 1%. Banks are notably weak in the region following UK proposals to tax banks to pay down deficits.
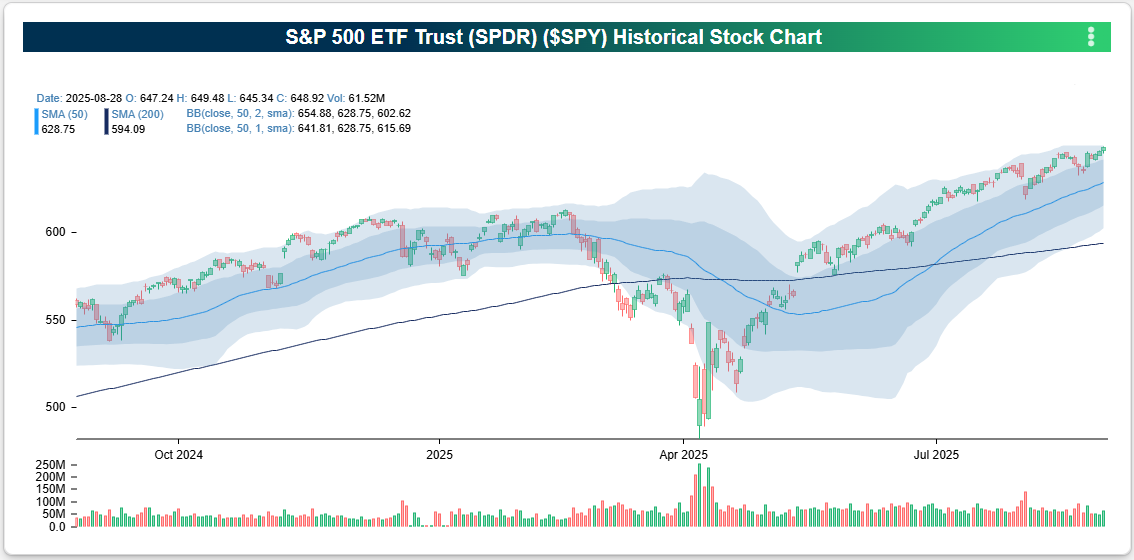
Heading into this last trading day of the summer, the S&P 500 has been in rally mode, notching its 20th record closing high of the year, rallying over 2% since last Thursday, and trading well into short-term overbought territory.
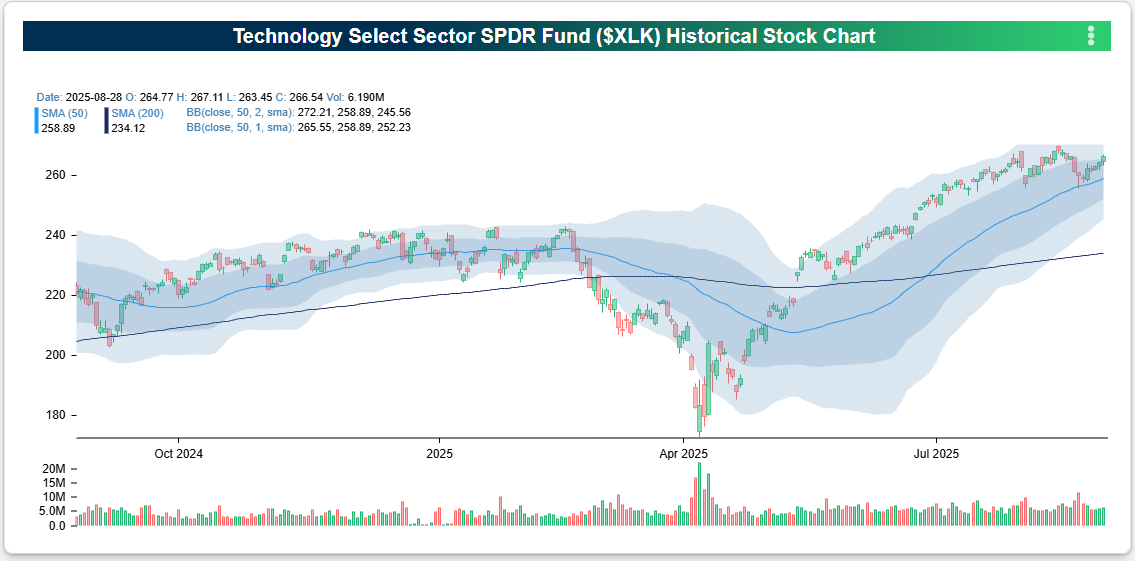
One interesting aspect of the rally is that the new highs have come without the Technology sector making new highs in tow. The sector hasn’t exactly been lagging, but it hasn’t made a new high since August 13th.
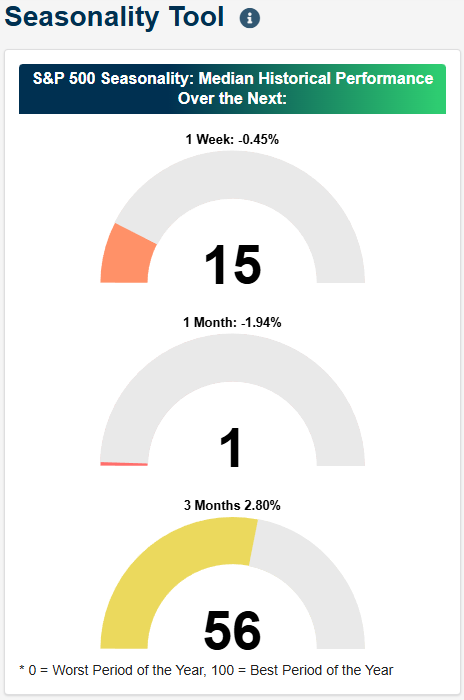
If the rally is to continue in the short term, the market will also need to do it without seasonality working in its favor. As shown in the Seasonality tool on our website, the S&P 500’s median performance over the next week based on the last ten years of data has been a decline of 0.45% which ranks in the 15th percentile of all one-week readings throughout the year. The median one-month performance has been a decline of 1.94% which is among the worst one-month periods of the year! As bad as that is, the median three-month performance is positive at 2.8% which ranks in the 56th percentile of all rolling three-month periods. Historically, the last three months of the year have been positive, but we still have to get through September first!
Aug 28, 2025
See what’s driving market performance around the world in today’s Morning Lineup. Bespoke’s Morning Lineup is the best way to start your trading day. Read it now by starting a two-week trial to Bespoke Premium. CLICK HERE to learn more and start your trial.
“There is nothing more frightful than ignorance in action.” – Johann Wolfgang von Goethe
Below is a snippet of commentary from today’s Morning Lineup. Start a two-week trial to Bespoke Premium to view the full report.
It’s another quiet morning in the markets despite what has been a busy overnight session for earnings. Of the 33 companies that reported since the close yesterday, just six missed EPS forecasts. On the geo-political front, there have been some ripples as Mexico announced that it will increase tariffs on Chinese imports, while Japan’s trade representative has cancelled a planned trip to the US, which will further delay trade negotiations. Regarding the Fed, the only speaker on the calendar today is Governor Waller after the close.
The economic calendar is busy this morning. Q2 revised GDP came in at 3.3% vs forecasts for 3.1% while Personal Consumption and the GDP Price Index were right in line with forecasts. Initial Jobless Claims came in at 229K, which was 1K lower than estimates. Continuing Claims, which have been drifting higher lately, also came in lower than expected at 1.954 million versus forecasts for 1.966 million.
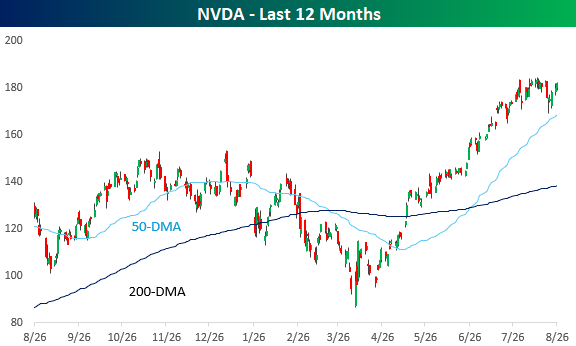
We made it through NVDA’s earnings report. The world’s largest publicly traded company released an uneventful earnings report last night, and while results were better than expected, that hasn’t been enough this earnings season to provide a meaningful boost to a stock’s price. In pre-market trading, NVDA is trading down less than 2%, which is basically a rounding error relative to the stock’s historical reaction to earnings. Over the last 25 years, NVDA’s average one-day reaction to earnings has been a gain or loss of just under 8%. Since the launch of ChatGPT, there have only been two other quarters out of 11 where the stock gapped up or down less than 2% in reaction to earnings, and today will likely be the third time in the last 12. For more than a week, all we heard about was the importance of NVDA’s earnings report and what it would mean for the market. Well, NVDA earnings came, and NVDA earnings went, and the most hyped earnings report in weeks has ended up being a non-event.
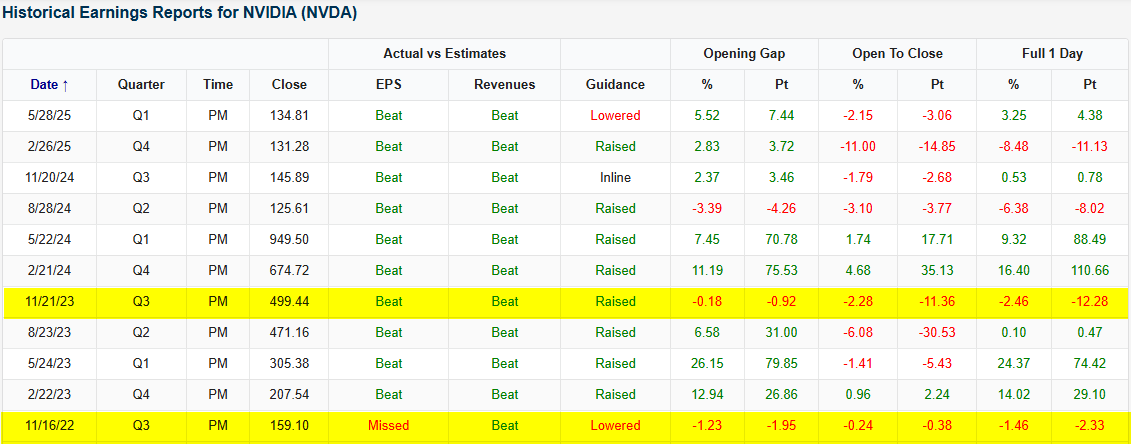
NVDA came into last night’s earnings report in a bit of a holding pattern after hitting record highs a couple of weeks ago. The stock has been gradually trending lower in the short term, but remains above its 50-DMA, so provided the stock doesn’t experience a significant move during the trading session, today’s action and last night’s report will have no impact on the stock’s technical picture.
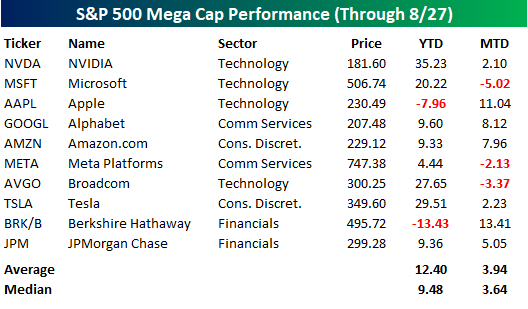
There’s been a lot of talk over the last several weeks regarding rotation within the market, but strength at the top has been consistent. The ten largest stocks in the S&P 500 are up an average of 3.94% (median: 3.64%) so far this month, and just three are in the red. On a YTD basis, the ten stocks are up an average of 12.40% (median: 9.48%), and only two are down.
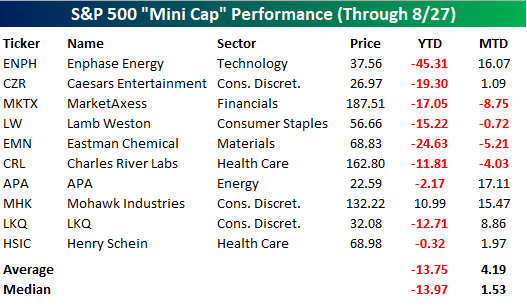
At the other end of the market cap spectrum within the S&P 500, the ten smallest stocks in the index are slightly underperforming the ten largest stocks this month on an average basis but outperforming on a median basis. Where the big discrepancy shows up is in the YTD column, where the average performance has been a decline of 13.75%, or a performance gap of more than 26 percentage points!
Aug 27, 2025
See what’s driving market performance around the world in today’s Morning Lineup. Bespoke’s Morning Lineup is the best way to start your trading day. Read it now by starting a two-week trial to Bespoke Premium. CLICK HERE to learn more and start your trial.
“We’re moving from a world where we have to understand computers to a world where they will understand us.” – Jensen Huang
Below is a snippet of commentary from today’s Morning Lineup. Start a two-week trial to Bespoke Premium to view the full report.
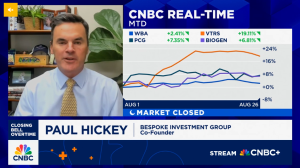
If you missed yesterday’s CNBC segment discussing recent market rotation, you can watch it by clicking on the image below.
It’s another quiet market morning with futures indicating just a modest gain at the open. Treasury yields are modestly higher across the curve, while crude oil is essentially flat at around $63 per barrel. In contrast, gold and other metals are slightly lower. There’s no economic data on the calendar this morning, and, outside of some earnings from retailers like Abercrombie & Fitch (ANF), Kohl’s (KSS), and Williams-Sonoma (WSM), the earnings calendar is light. Even the endless coverage of the Cook firing has subsided!
The quiet tone will change this afternoon when Nvidia (NVDA) reports after the close. Along with NVDA, we’ll also get reports from HP (HOQ), CrowdStrike (CRWD), NetApp (NTAP), and Urban Outfitters (URBN). The next two days will also be much busier on the economic calendar, so enjoy the calm while it lasts.
In Asia overnight, Japan was slightly higher while China traded lower as Industrial Profits for July fell 1.7% on a YTD basis. Australian stocks finished the session with fractional gains despite a CPI report which came in much higher than expected at 2.8% y/y versus forecasts for an increase of 2.3%.
European stocks are also trading much like US futures with little in the way of gains or losses. The STOXX 600 is up 0.15% with Germany trading slightly lower while France is bouncing back 0.45% from Tuesday’s 1.6% decline.
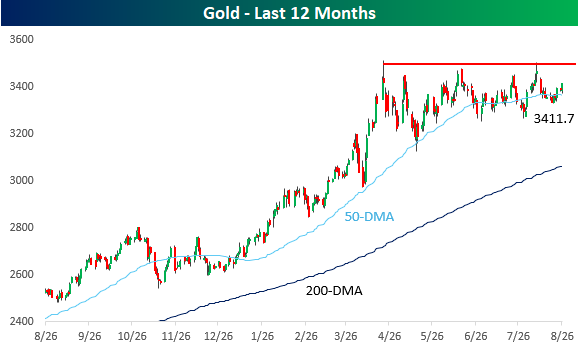
Gold prices are doing little this morning, and the last few months have been like watching paint dry for the yellow metal. After hitting an all-time high just above $3,500 per ounce in early April, gold has made multiple other attempts at breaking out above that level. While they have been unsuccessful, gold hasn’t sold off following those rejections, which has resulted in a relatively narrow range in recent months.
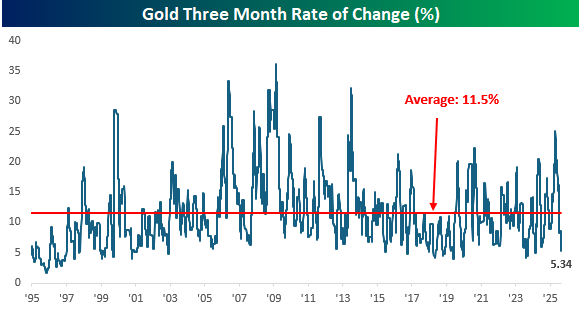
Over the last three months (63 trading days), in fact, the spread between gold’s intraday high and low has been just 5.34%, the narrowest three-day range since March 2024 and ranking in the bottom decile of three-month ranges over the last 30 years. This narrow range also marks a major shift from where this measure was four months ago in April, when the range topped 25% which was the widest since 2013.
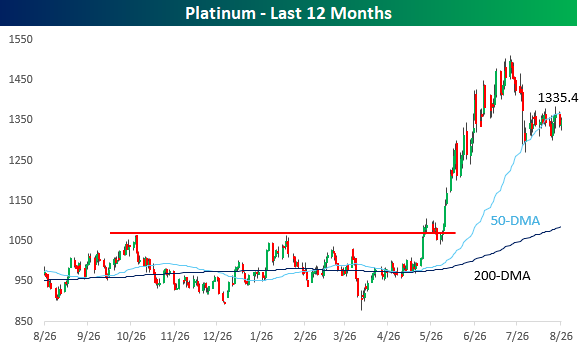
Like gold, platinum had been stuck in a range for several months from the second half of last year, with multiple run-ins with resistance just below $1,070. In late May/early June, though, it broke out of that range with vengeance surging as high as $1,500 before pulling back in July. Since that peak a little over a month ago, platinum has pulled back by about 11% and is now teetering on the 50-DMA, tenuously holding onto support. After such a large rally in such a short period, it’s only natural to see a pullback, so if these levels can hold, in the days ahead, platinum could start to look even more precious in the eyes of investors than it did even back in June.