Sep 12, 2025
See what’s driving market performance around the world in today’s Morning Lineup. Bespoke’s Morning Lineup is the best way to start your trading day. Read it now by starting a two-week trial to Bespoke Premium. CLICK HERE to learn more and start your trial.
“A cynic is a man who, when he smells flowers, looks around for a coffin.” – H.L. Mencken

Below is a snippet of commentary from today’s Morning Lineup. Start a two-week trial to Bespoke Premium to view the full report.
Well, the market can’t go up every day. Equity futures are on pace to close out the week on a modestly weaker note as the Dow and S&P 500 are indicated to open the session modestly lower. For its part, the Nasdaq is looking at modest gains following strong earnings from Adobe (ADBE), which has that stock trading up 3%. The 10-year yield is two bps higher, but at less than 4.04%, it’s been a good week for longer-term treasuries. Crude oil is up fractionally, along with most precious metals, but silver is up closer to 2%. In crypto, Bitcoin is looking at modest gain as it flirts with $115K, but Ethereum is back above $4,500 with a gain of over 2%, while Solana, the newest flavor of the month in the space, has surged over 5% to $239 and its highest levels since January.
The uneventful tone in the US follows what was mostly a positive session in Asia as Japan and South Korea rallied to new all-time highs. Outside of Australia, all the major averages in the region finished the week with gains of at least 1%, and in most cases more.
In Europe, the tone has been more subdued as the STOXX is trading slightly lower along with most major country benchmarks. For the week, though, returns have also been positive with gains of roughly 1%. One negative item has been growth in the UK, where GDP was unchanged in July, versus forecasts for an increase of 0.4%. Meanwhile, Industrial Production, which was forecast to be unchanged versus June, dropped by 0.9%.
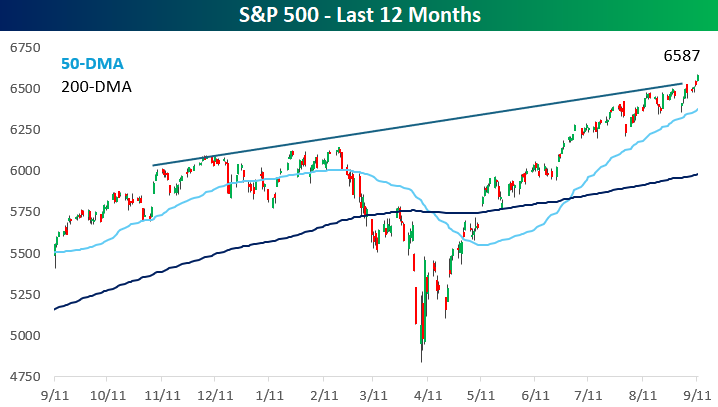
Yesterday’s weaker-than-expected jobless claims report and mostly in-line CPI solidified the case for multiple FOMC rate cuts in the months ahead. The market responded with a very broad-based rally as over 85% of S&P 500 stocks traded higher on the session, and small caps outperformed large caps. The S&P 500’s 0.85% rally took it to another record closing high as the index now pushes up against a trendline that has been in place for the last year. As shown in the chart below, while stocks sold off sharply after the index bumped up against this rising ceiling early in the year, most times it has encountered this trendline, the pullbacks were modest.
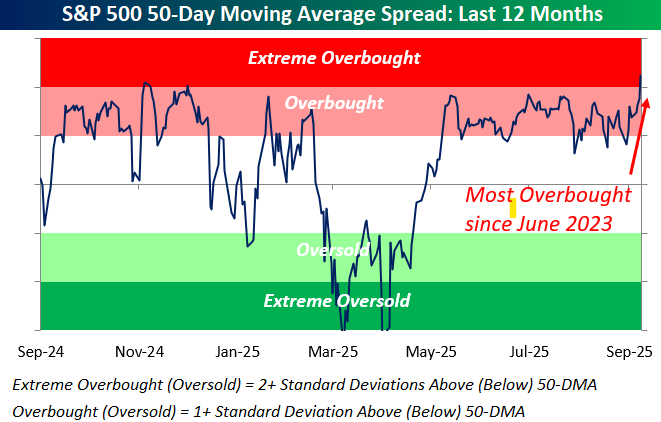
Following yesterday’s rally, the S&P 500 has now moved into ‘extreme’ overbought territory on a short-term basis, which we define as more than two standard deviations above its 50-day moving average (DMA). The last time it traded at more overbought levels was back in June 2023. We’ll have more on these ‘extreme’ overbought readings in tonight’s Bespoke Report.
With yesterday’s new high, the S&P 500 has now had 24 record closing highs this year. While it’s above the historical average of 18 per year, 24 is hardly extreme by any stretch of the imagination, and it’s less than half of last year’s total of 57. On the other hand, back in early April, was anyone thinking we’d be anywhere close to new highs later this year, let alone hitting them multiple times? Be honest!
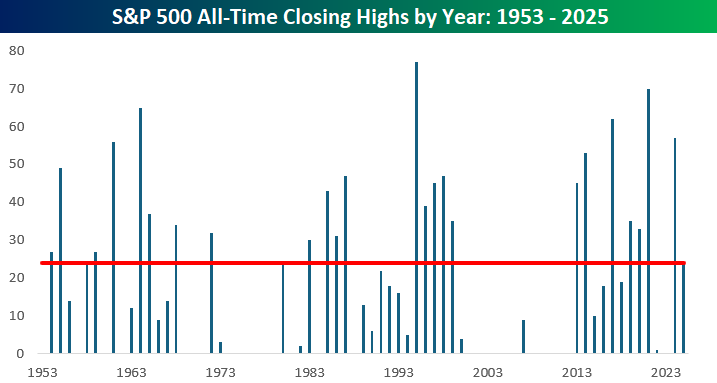
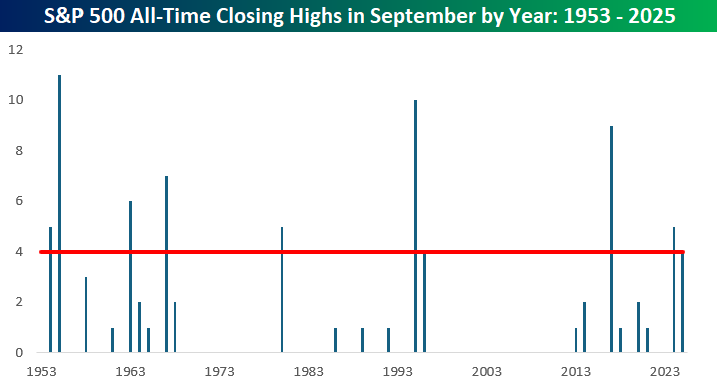
While September is historically known for its weakness, the S&P 500 has already had four record closing highs in eight trading days this month. That may be short of last year’s total of five, but there’s still another 13 trading days left in the month! The record for closing highs in September was 11 in 1955, followed by 10 in 1995, and 9 in 2017. If your memory is good (and long), you’ll remember that those were all good years, and some people reading this may have even been around for all of them!
Sep 11, 2025
See what’s driving market performance around the world in today’s Morning Lineup. Bespoke’s Morning Lineup is the best way to start your trading day. Read it now by starting a two-week trial to Bespoke Premium. CLICK HERE to learn more and start your trial.
“We just need every single person in this country to think about where we are and where we want to be. To ask ourselves, is this it?” – Spencer Cox
Below is a snippet of commentary from today’s Morning Lineup. Start a two-week trial to Bespoke Premium to view the full report.
Between the 24th anniversary of 9/11 and the political violence in Utah, there’s a lot to think about this morning before even considering the markets. The big news of the day will obviously be the August CPI report, along with jobless claims, which are just hitting the tape as we send this. Overnight, Asia had a mixed session with the Nikkei up over 1%, while Chinese equities also surged 1.7% following reports that the government will provide more stimulus for state-backed banks. On the trade front, though, Mexico said it will increase tariffs on vehicle imports from Asia to 50% from 20%.
In Europe this morning, the STOXX 600 is up 0.4% and every major country equity benchmark is also trading in the green. As expected, the ECB left rates unchanged.
In the US, equity futures were modestly higher heading into the data, while treasury yields were up about 2 bps across the curve. Crude oil and gold were fractionally lower, while cryptocurrencies were broadly higher, with Ethereum up over 3%.
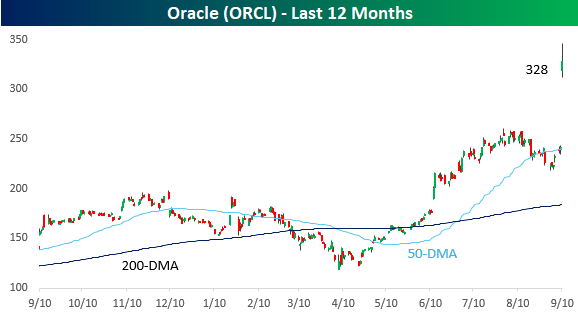
Yesterday’s surge in Oracle (ORCL) was unbelievable. If you saw the chart pattern below for a small-cap stock, it would look impressive, but when one of the largest companies in the world experiences a breakout like that, it’s jaw-dropping.
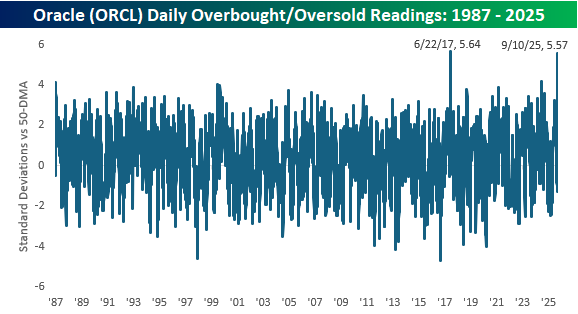
With yesterday’s surge, shares of ORCL reached ludicrously short-term overbought levels by closing 5.57 standard deviations above its 50-day moving average (DMA). As crazy as that level is, it’s not even the most overbought reading ORCL has ever registered. As shown in the chart below, back on 6/22/17, ORCL shares closed 5.64 standard deviations above their 50-DMA after the company reported an earnings report which showed strong growth in its cloud business.
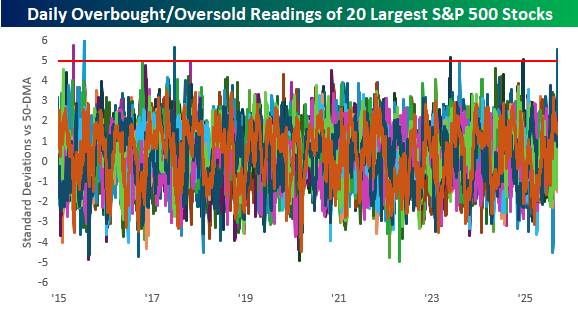
The chart below looks like a mess, and we don’t expect you to get too much insight from it. What it shows is the daily overbought/oversold readings for the 20 largest stocks in the S&P 500 over the last ten years. The point here is to show that it’s incredibly uncommon for large and mega-cap stocks to reach overbought levels like ORCL did yesterday. It’s only happened a handful of other times!
Sep 10, 2025
See what’s driving market performance around the world in today’s Morning Lineup. Bespoke’s Morning Lineup is the best way to start your trading day. Read it now by starting a two-week trial to Bespoke Premium. CLICK HERE to learn more and start your trial.
“I believe people have to follow their dreams – I did.” – Larry Ellison
Below is a snippet of commentary from today’s Morning Lineup. Start a two-week trial to Bespoke Premium to view the full report.
Between Oracle’s (ORCL) 30%+ surge this morning and a weaker-than-expected PPI report, you would expect futures to be higher, but maybe the biggest surprise is that they aren’t up more. Both the S&P 500 and Nasdaq are indicated to open up 0.5%, and given it’s still September, bulls will take all they can get. Treasury yields are little changed, commodities are fractionally higher, and crypto is seeing the largest gains as Bitcoin and Ethereum are both up over 1.5%.
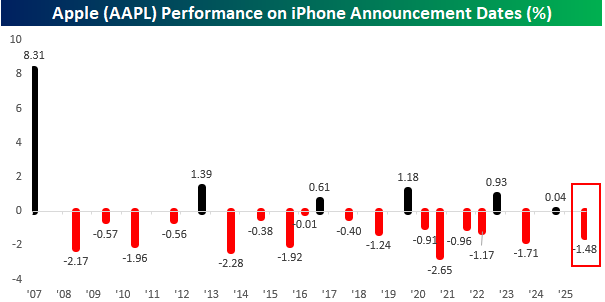
The market’s focus has now shifted to the upcoming inflation data, but yesterday, Apple (AAPL) was a focus with the launch of the latest iPhone models. As noted in our Chart of the Day from Monday, AAPL’s performance on the day of iPhone announcements has been weak, and yesterday was no exception as the stock fell 1.48%. As shown in the chart, for all the gains AAPL has had in the iPhone era, one of the worst days to own the stock has been on these announcement days.
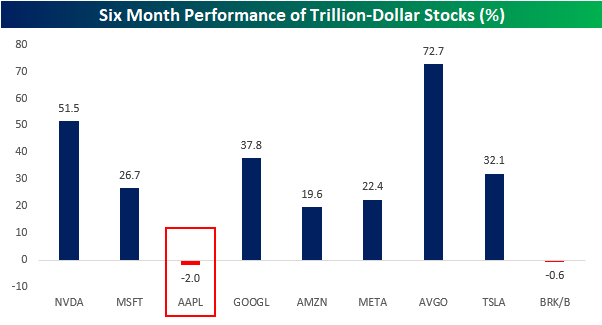
Normally, AAPL’s stock performs well in the lead-up to iPhone announcements, but that hasn’t been the case this year. Over the last six months, the stock has declined 2%, which is weaker than any of the other nine trillion-dollar S&P 500 stocks. The only other one that is down during this stretch is Berkshire Hathaway (BRK/b), which also happens to be one of the company’s largest shareholders.
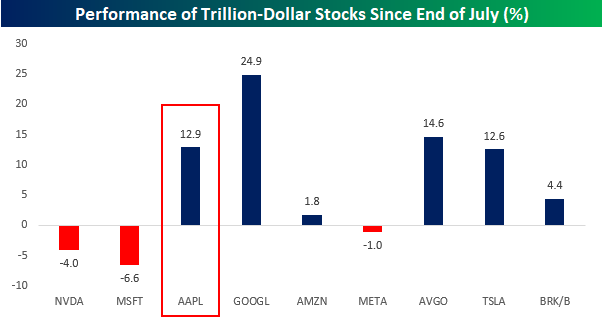
More recently, though, AAPL has started to turn the corner. Since the start of August, the stock has rallied 12.9% which ranks as the fourth-best among the trillion-dollar stocks, trailing Alphabet (GOOGL), Broadcom (AVGO), and Tesla (TSLA).
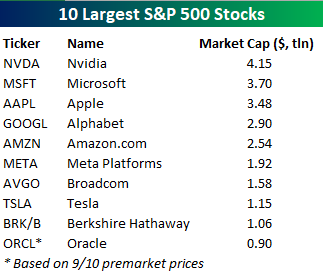
Speaking of the largest stocks, the trillion-dollar club may be on the verge of getting a new member. As of yesterday’s close, shares of Oracle (ORCL) had a market cap of $680 billion. After reporting a blowout earnings report, though, the stock is trading nearly 32% higher in the pre-market, which would take its market cap up just shy of $900 billion, catapulting it from the 13th largest stock in the S&P 500 and into the top ten list. It’s hard to comprehend just how large a move ORCL is having in reaction to its earnings. Only 42 companies in the S&P 500 have a larger market cap than ORCL’s market cap increase since the close yesterday, and it’s also larger than the entire market cap of Disney (DIS). Less than 0.35% of all earnings reports since 2001 have seen a stock rally more than 31% in reaction to earnings, and in those rare instances, the gains have been typically in small and micro-cap stocks.
Sep 9, 2025
See what’s driving market performance around the world in today’s Morning Lineup. Bespoke’s Morning Lineup is the best way to start your trading day. Read it now by starting a two-week trial to Bespoke Premium. CLICK HERE to learn more and start your trial.
“Wrong does not cease to be wrong because the majority share in it.” – Leo Tolstoy
Below is a snippet of commentary from today’s Morning Lineup. Start a two-week trial to Bespoke Premium to view the full report.
After modest gains in US equities to start the week, futures have a positive bias this morning ahead of a relatively quiet day for economic data. The only report on the calendar is the NFIB Small Business Confidence report for August, which came in slightly better than forecasts, rising from 100.3 to 100.8.
An even bigger news story today will be the Preliminary Benchmark Payrolls Revision from the BLS. While the data is even more backward-looking than most other economic data, the headline number is expected to show a large downward revision to the number of jobs created between April 2024 and March 2025. Economists forecast the downward revision to anywhere between a loss of 450K to 900K, so you can guarantee that at the very least, both sides of the political aisle will seize on the headlines.
Finally, Apple (AAPL) will hold its ‘awe-dropping’ iPhone event at 1 PM eastern, where a new line of phones, along with updated iPads, watches, and AirPods, are expected. If you didn’t see it yesterday, make sure to check out yesterday’s Chart of the Day, where we looked at the stock’s performance around prior iPhone launch events.
Besides the modestly positive tone in equities, treasury yields are slightly higher, but the 10-year is still under 4.07%, and WTI, while higher by about 1%, is still below $63 per barrel. In the metals market, performance is mixed with modest gains in gold and platinum, while silver is slightly lower. Lastly, crypto is higher across the board with Bitcoin, Ethereum, and Solana all up by close to 1%.
Outside of the US, Asian equities were mixed overnight. The Nikkei broke a streak of three straight days of at least 1%+ gains with a decline of 0.4%, while China’s Shanghai Composite fell 0.5%. European stocks are hanging on to small gains (0.14%). Germany is the biggest outlier with a decline of 0.4% while other countries in the region are offsetting those losses.
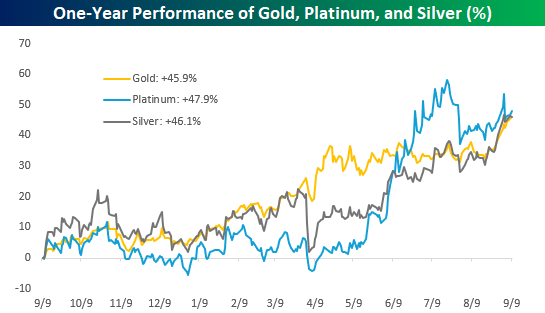
When it comes to precious metals and crypto, the first asset that immediately comes to mind for most people is gold, and given its recent performance, deservedly so. However, when you look at gold’s performance in comparison to other major precious metals like platinum and silver, their performances are nearly identical. Over the last year, gold has gained 45.9% while platinum and silver have rallied 47.9% and 46.1%, respectively. Their paths haven’t necessarily been identical, but they’ve ended up at the same place.
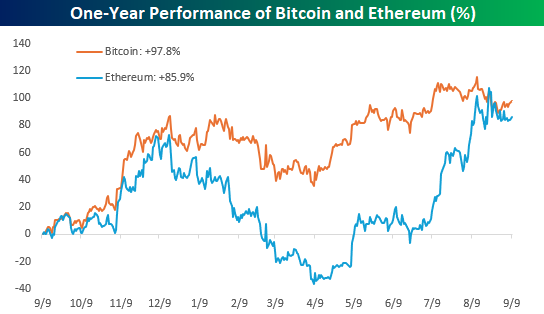
In the crypto space, Bitcoin is effectively the gold standard, and for most ‘investors’, it is the crypto market. Here again, Bitcoin’s performance hasn’t been much different than the ‘silver’ of that market – Ethereum. Here again, the paths of the two cryptos haven’t necessarily been the same, but they’ve essentially ended up at the same place. While Bitcoin is up 97.8% over the last year, Ethereum’s 85.9% gain isn’t far behind, especially for an asset class as volatile as crypto.
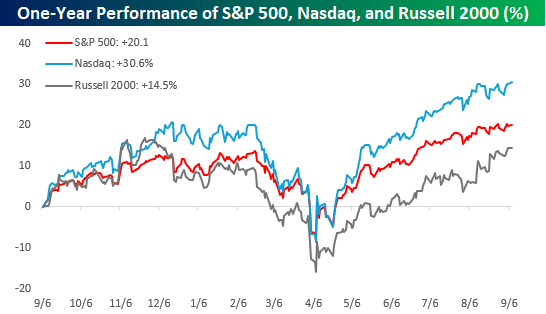
While the major metals and cryptos have had similar performances to each other over the last year, the same can’t be said for equities. While their trading patterns have been similar over the last year, the Russell 2000’s 14.5% gain comes up well short of the S&P 500’s 20.1% gain and pales in comparison to the Nasdaq’s gain of over 30%. While precious metals and, to a lesser degree, the leading cryptos have been almost interchangeable in their performance over the last year, equities, the most liquid of the three asset classes, have seen more varied returns.
Sep 8, 2025
See what’s driving market performance around the world in today’s Morning Lineup. Bespoke’s Morning Lineup is the best way to start your trading day. Read it now by starting a two-week trial to Bespoke Premium. CLICK HERE to learn more and start your trial.
“Time lost can never be recovered.” – Erik Larson
Below is a snippet of commentary from today’s Morning Lineup. Start a two-week trial to Bespoke Premium to view the full report.
In terms of economic activity, last week’s ISM Services report was better than expected and firmly in growth territory at 52.0, but the ISM Manufacturing and August payrolls reports both missed expectations, lending some credence to the idea that the economy is showing signs of slowing. This week, the focus will shift to inflation with Wednesday’s PPI and Thursday’s CPI reports for August. Secondary indicators of inflation have shown some upward pressure, so the market is clearly more concerned with these indicators coming in hot. How hot is the question? While a September cut next week is likely a done deal, the pace of cuts moving forward from there will hinge in large part on how ‘bad’ the inflation data is. Come Thursday morning, the market will either be only thinking about stagflation or three cuts between now and year-end.
It’s been a slow start to the week stateside, and the only economic report on the calendar this morning is the NY Fed’s Survey of Consumer Expectations, and the focus of that will be inflation expectations. Futures are modestly higher, along with crude oil, gold, and crypto.
Asian equities started off the week positive. The Nikkei rallied 1.5% closing just shy of a new high, while China was up a little less than 0.5%. Japanese GDP for Q2 came in better than expected, and China’s trade surplus handily beat expectations.
In Europe, equities kicked off the week on a positive note. The STOXX 600 is up about 0.3% as Spain and Germany lead the way higher. Investor sentiment from Sentix came in weaker than expected and declined modestly from August, but Industrial Production in Germany managed to exceed forecasts with a slightly better than expected increase.
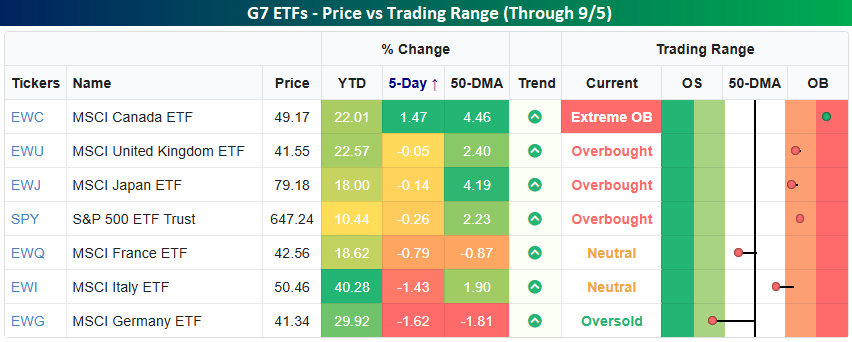
Last week was literally a middle-of-the-road week for the S&P 500. As shown in the snapshot of the ETFs tracking the equity markets of each of the G7 countries, the SPDR S&P 500 ETF’s decline of 0.26% from the close on 8/28 (due to last Monday’s Labor Day holiday) was right in the middle relative to the other six country ETFs. Canada (EWC) was the big winner of the group with a gain of 1.47% while every other ETF traded lower. Performance in the UK (EWU) and Japan (EWJ) was less bad than the US, while Germany (EWG) and Italy (EWI) both declined over 1%, and France (EWQ) fell 0.79%.
With respect to their trading ranges, Germany is the only country in the G7 trading at oversold levels, while France is the only other one trading below its 50-DMA. At the other end of the spectrum, the US and the three other countries that outperformed it last week are all at overbought or ‘extreme’ overbought levels (2+ standard deviations above their 50-DMAs).
While the US was right in the middle of the road last week, with its 10.44% YTD gain, it is still easily the weakest performer among the G7. In fact, the next closest performer is Japan with a gain of 18% while Italy is up over 40%!
Sep 5, 2025
See what’s driving market performance around the world in today’s Morning Lineup. Bespoke’s Morning Lineup is the best way to start your trading day. Read it now by starting a two-week trial to Bespoke Premium. CLICK HERE to learn more and start your trial.
“Change before you’re forced to change.” – Roger Goodell
Below is a snippet of commentary from today’s Morning Lineup. Start a two-week trial to Bespoke Premium to view the full report.
Futures are in rally mode this morning ahead of the Non-Farm Payrolls report at 8:30, while treasury yields are at their lows for the week. The rally in US stocks follows what has been a strong morning in Europe, as well as some solid gains in Asia.
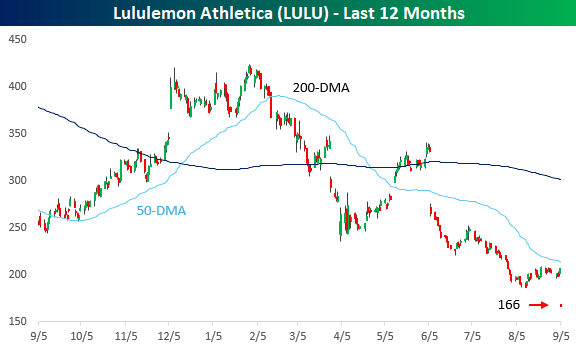
Earnings season may be mostly in the rearview mirror, but some reports are still trickling in, and last night saw a very disappointing report from Lululemon (LULU). While the athletic apparel maker reported better-than-expected earnings on inline revenues, full-year earnings guidance was slashed by 10%. While the stock was only trading at 14 times earnings heading into the report, investors are not taking kindly to the lowered guidance. In pre-market trading, shares of LULU are down roughly 20% to their lowest level since March 2020. Earlier this year, the stock was trading as high as $420. It’s at $166 now!
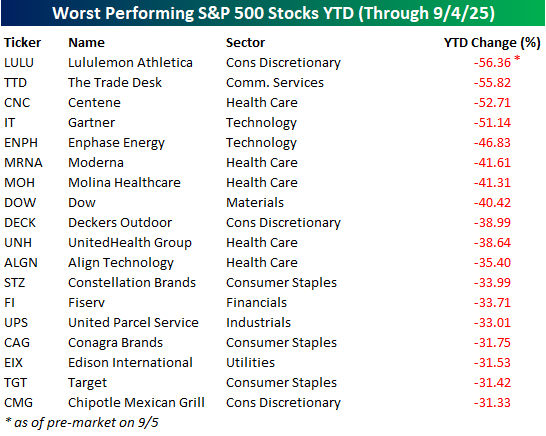
Taking into account this morning’s decline, LULU now ranks as the S&P 500’s worst-performing stock on a YTD basis and is one of just four stocks in the index that have lost more than half of their value. The other three are The Trade Desk (TTD), Centene (CNC), and Gartner (IT). Along with those four stocks, another 14 are down over 30%, including Deckers Outdoors (DECK), Align Technology (ALGN), and Chipotle (CMG). There was a time when these stocks were among the biggest highfliers, but nowhere is the phrase “what have you done for me lately” more applicable than in the stock market.
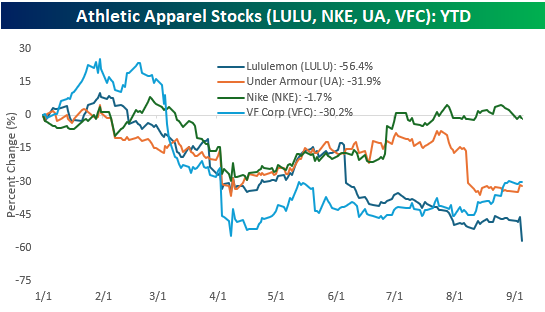
LULU’s decline has been painful, but it has also been part of a broader decline in athletic apparel companies. While none of them are down anywhere nearly as much as LULU, shares of Nike (NKE), Under Armour (UA), and VF Corp (VFC) are all in the red YTD. With a “workout” these days now involving nothing more than a jab in the thigh, you don’t need yoga pants and a pair of sneakers to do that!
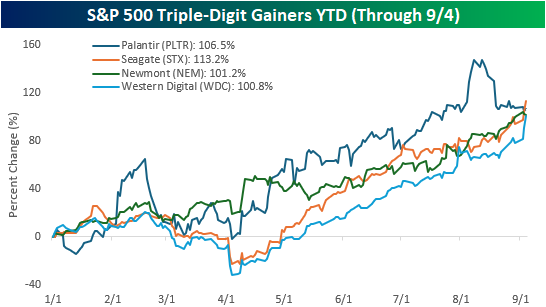
Enough of the bad news. If we’re going to dwell on the worst-performing stocks in the market this year, we have to give equal time to the top performers, so the table below shows the 15 stocks in the S&P 500 that are up at least 50% YTD. You may think that the market is being led entirely by tech, but six sectors are represented on the list of the 15 biggest winners. Tech is tied for the lead in terms of representation, but four stocks from the Industrials sector are also represented, including GE Vernona (GEV) and General Electric (GE). As hard as it would have been to imagine a couple of years ago seeing LULU, DECK, ALGN, and CMG on the list of biggest losers, it would have been just as hard to think a stock with “GE” in its name would ever be on the biggest winners list, let alone two!
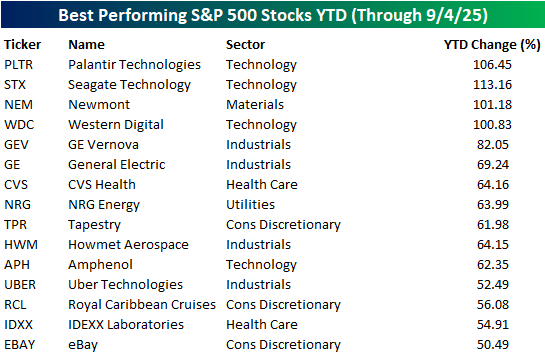
At the top of the list of biggest winners were four stocks that have already doubled this year – Palantir (PLTR), Seagate (STX), Newmont (NEM), and Western Digital (WDC). Seeing PLTR at the top of the list isn’t surprising, but STX, NEM, and WDC? Where did they come from? Goldminers aren’t exactly the sexiest stocks in the market, and when most investors think of tech stocks, STX and WDC are probably two of the last stocks that come to mind. It just goes to show that the biggest winners in the market often come from places seemingly out of the blue where the fewest investors are looking.