Nov 4, 2015
Today’s Chart of the Day looks at how the percentage of overbought stocks in the S&P 500 has risen sharply in the last few weeks, and when the last time we saw as large an increase over such a short period of time.
To continue reading our Chart of the Day, click below to start a free Bespoke Premium trial. With Bespoke Premium, you’ll also receive access to our model stock portfolios, daily market alerts, and weekly Bespoke Report newsletter.
If you apply the coupon code “CHARTS” at checkout, you’ll receive 10% off the price of your monthly membership for life!
[thrive_leads id=’59052′]
Nov 3, 2015
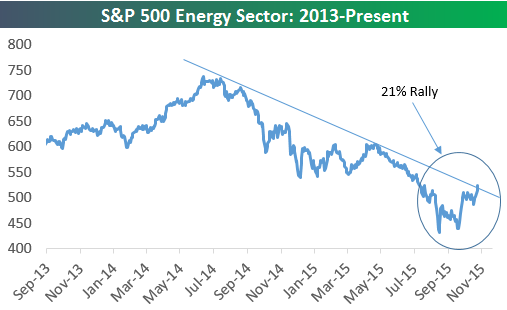
Today’s Chart of the Day looks at a newly formed bull market for the S&P 500 Energy sector. After experiencing its longest bear market on record from mid-2014 through this August, the Energy sector has now bounced 21% off its lows. In today’s full Chart of the Day report, we look at historical bull and bear markets for the sector to show subscribers what they can expect going forward.
To continue reading our Chart of the Day, click below to start a free Bespoke Premium trial. With Bespoke Premium, you’ll also receive access to our model stock portfolios, daily market alerts, and weekly Bespoke Report newsletter.
If you apply the coupon code “CHARTS” at checkout, you’ll receive 10% off the price of your monthly membership for life!
[thrive_leads id=’59052′]
Nov 2, 2015
Today’s Chart of the Day highlights four stocks that recently reported earnings “triple plays” whose chart patterns look very attractive. An earnings “triple play” is a term coined by Bespoke for a stock that beats earnings estimates, beats revenue estimates, and raises guidance. These are stocks that we consider the “cream of the crop” during earnings season, and we’re constantly analyzing them for potential long opportunities.
To see the four stocks featured in today’s Chart of the Day, click below to start a free Bespoke Premium trial. With Bespoke Premium, you’ll also receive access to our model stock portfolios, daily market alerts, and weekly Bespoke Report newsletter.
If you apply the coupon code “CHARTS” at checkout, you’ll receive 10% off the price of your monthly membership for life!
[thrive_leads id=’59052′]
Oct 30, 2015
Today’s Chart of the Day looks at this week’s sentiment survey from the American Association of Individual Investors (AAII) and how this week’s results stack up against recent results.
If you’re not yet a Chart of the Day subscriber, click below to start a free Bespoke Premium trial. With Bespoke Premium, you’ll also receive access to our model stock portfolios, daily market alerts, and weekly Bespoke Report newsletter.
If you apply the coupon code “CHARTS” at checkout, you’ll receive 10% off the price of your monthly membership for life!
[thrive_leads id=’59052′]
Oct 29, 2015
Today’s Chart of the Day looks at this week’s sentiment survey from the American Association of Individual Investors (AAII) and how this week’s results stack up against recent results.
If you’re not yet a Chart of the Day subscriber, click below to start a free Bespoke Premium trial. With Bespoke Premium, you’ll also receive access to our model stock portfolios, daily market alerts, and weekly Bespoke Report newsletter.
If you apply the coupon code “CHARTS” at checkout, you’ll receive 10% off the price of your monthly membership for life!
[thrive_leads id=’59052′]
Oct 28, 2015
Today’s Chart of the Day follows on the theme of yesterday’s chart and looks at sentiment towards the Energy sector in terms of short interest, which has skyrocketed over the last several months.
If you’re not yet a Chart of the Day subscriber, click below to start a free Bespoke Premium trial. With Bespoke Premium, you’ll also receive access to our model stock portfolios, daily market alerts, and weekly Bespoke Report newsletter.
If you apply the coupon code “CHARTS” at checkout, you’ll receive 10% off the price of your monthly membership for life!
[thrive_leads id=’59052′]