Chart of the Day: Two Green Lights and a Stop
Bespoke’s Chart of the Day is published Monday through Thursday. It’s available across all three of Bespoke’s membership levels, which you can learn more about here. We’ve decided to make today’s Chart of the Day available to our Think B.I.G. readers. Enjoy!
Bespoke’s Chart of the Day for 4/26/17:
Three Bespoke Model Growth Portfolio names have moved huge on earnings in the last 24 hours. Two are current members of the portfolio, while a third is one we were stopped out of just last week. Below we provide a few thoughts on each. (You can view the entire portfolio along with performance numbers here.)
We’ll start with a huge win for Steve Wynn’s Wynn Resorts (WYNN), which beat on EPS and revenues last night. The business continues to improve as Chinese activity rebounds and one analyst upgraded the stock. Macau revenues are exploding as the Palace property builds steam, with combined Macau + Palace segment revenues +75% YoY. We’re still bullish on WYNN here even though we have an 87.5% gain on the position since we entered at $67.03 on 1/4/16. Note the chart below. Even though WYNN is now up 144% off its multi-year low, remember that back in early 2014 this was a $250 stock. At its current price, it still needs another double to get back to new highs.

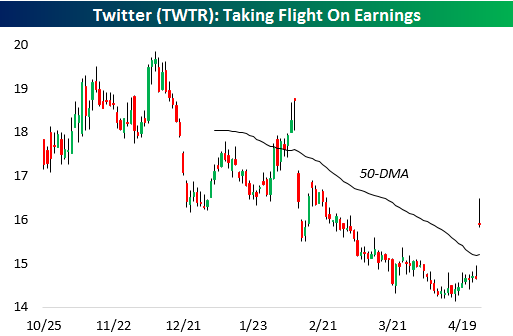
Moving on to our second position, Twitter (TWTR) is up 9.6% on the day after having ground lower almost constantly over the past year as take-out prospects dimmed and the business continued to show soggy user growth versus peers. GAAP EPS losses were half of analyst estimates in this morning’s announcement, though, with revenues and users also beating estimates. The name is still down from our $18.70 entry level but the beat this quarter and subsequent price rise means that nearly universal negative sentiment towards the name finally appears to be turning.
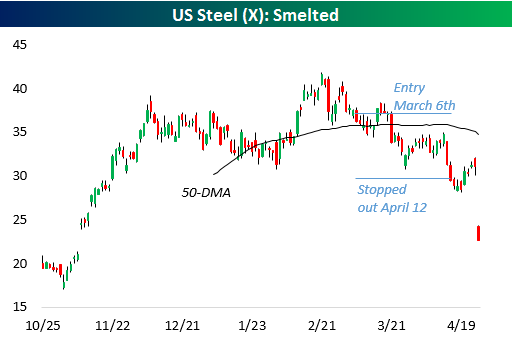
Our last name is US Steel (X). We liked the name in Q1 and added it to the portfolio on March 6th. Unfortunately, we were dead wrong, and the name sunk lower during our holding period, ultimately stopping us out on April 13th with a significant loss. That said, we were glad we respected the $29.60 stop that had been set. By exiting the name at that level, we avoided the catastrophe that was today’s earnings. X delivered an 83-cent per share loss on a comparable basis versus 35 cents profits estimated, a brutal performance. This is a good example of why we always respect stops, our most important risk management tool.
To unlock all of our Chart of the Days as well as our Bespoke Model Portfolio, choose any membership level now at our products page. Both are included with all three membership levels.
