Chart of the Day – Is the Long End of the Curve Signaling a Mistake?
This content is for members onlyChart of the Day: Intraday IBIT Selling
Bitcoin has been whipsawing around $90k for the last week or so. It ended last Friday right around where it’s trading this afternoon, but it’s also down a couple thousand dollars from its highs earlier this morning before the US equity market opened at 9:30 AM ET.
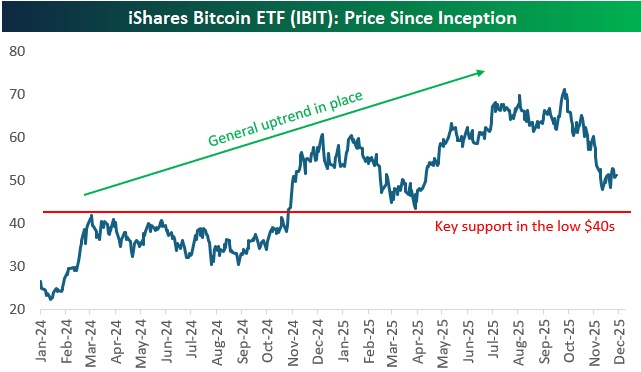
Below is a chart of the iShares Bitcoin ETF (IBIT) since it began trading in January 2024. While IBIT is in a pretty significant drawdown from its all-time high seen in October, its longer trend remains higher. A key support level has formed in the low $40s, and while we have not seen this level get tested during the current drawdown, it would be significant if this support were to break.
While the long-term chart for IBIT doesn’t look bad, the six-month chart looks pretty brutal:
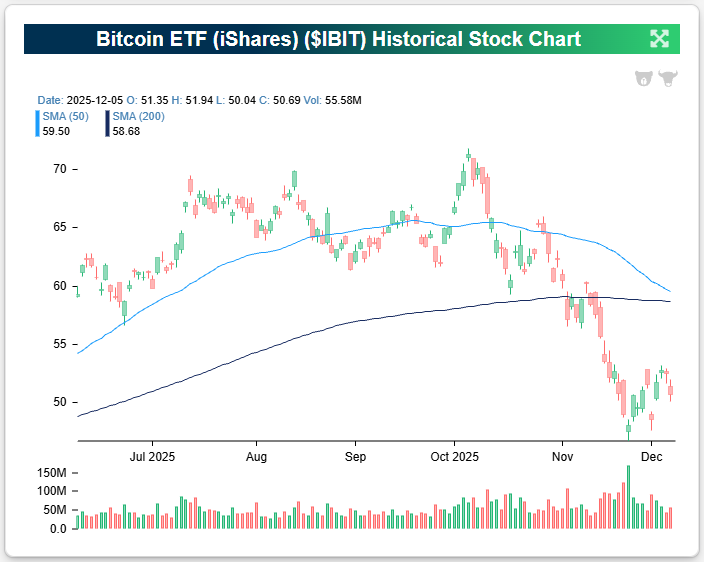
We’ve found what appears to be the problem for IBIT, which trades on US stock exchanges just like other ETFs across asset classes: it trades horribly when the stock market is open.
We looked at IBIT’s action in the six months covered in the chart above to see how it got to its 13.7% decline over this period. Amazingly…
To continue reading the remainder of our latest Chart of the Day, start a 30-day trial to Bespoke Premium or Bespoke Institutional today.
