Aug 9, 2016
Of the many breadth measures we track, one of the most useful for us is the percentage of stocks making new 52-week highs. When the market rallies and breaks out to a new high, you want to see the list of individual stocks making new highs getting larger. If that doesn’t happen, it is a signal that the rally is narrowing, and it can be a warning that the rally is coming to an end. That’s exactly what we saw in early 2015 when the S&P 500 rallied to new highs while the list of new individual stock highs began to contract.
Conversely, when the market is in a downturn, it is also important to watch the list of new lows to see how much participation there is in the downturn. Last August when equities tumbled, the percentage of S&P 500 stocks making new lows surged to 37.7% of the stocks in the index – the most negative reading since October 2011! The market bounced to close out 2015, but then it turned lower again following the hike in rates in December and the subsequent crash in oil prices. In late January of this year, the S&P 500 tested its August 2015 lows and the percentage of stocks making new lows also dropped down to similar levels (-36.9). From there, there was a feeble rally attempt which failed, but importantly when the S&P 500 broke down to new lows in early February, the percentage of stocks making news lows contracted to just 19.4%. This was a bullish divergence.
So how have new highs been trending in the S&P 500’s most recent leg higher? In a B.I.G. Tips report just sent out to Bespoke Premium and Bespoke Institutional clients, we provide an analysis of trends in 52-week highs for the S&P 500 and each of the ten sectors. We have also included a really interesting screen of stocks that are within 5% of a 52-week high but haven’t traded to a 52-week high in at least a year. To see the entire analysis, please sign up for a monthly Bespoke Premium membership below!
See the full B.I.G. Tips report by signing up for a monthly Bespoke Premium membership now. Click this link for a 10% discount ($89/month).
Aug 4, 2016
Heading into tomorrow’s Non Farm Payrolls (NFP) report for July, economists are expecting an increase in payrolls of 180K, which would be a big decline from last month’s huge upside surprise reading of 287K. In the private sector, economists are expecting an increase of 171K, which would be a similar decline to what economists are forecasting for the overall NFP reading. The unemployment rate is forecasted to tick back down to 4.8% after moving up to 4.9% last month. Growth in average hourly earnings is expected to accelerate back up to 0.2%, while hours worked is forecast to remain unchanged at 34.4. June’s employment report was a big positive surprise for the market and economists after the big disappointment in May, so hopefully now that those two have evened each other out, we will return back to levels more inline with the overall trend.

To see our complete preview of the July Employment report which was just sent to Bespoke Premium and Bespoke Institutional clients, please sign up for a monthly Bespoke Premium membership below!
See the full B.I.G. Tips report by signing up for a monthly Bespoke Premium membership now. Click this link for a 10% discount ($89/month).
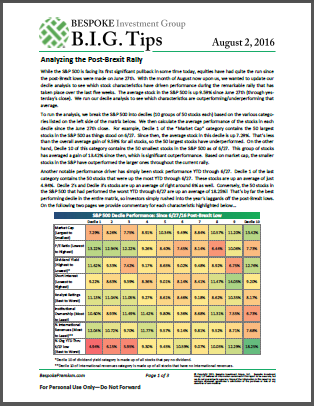
Aug 2, 2016
Earlier today, we sent Bespoke Premium and Bespoke Institutional members a brand new B.I.G. Tips report looking at the key stock characteristics driving performance since the S&P 500 made its post-Brexit low on June 27th. We looked at characteristics like market cap, dividend yield, valuations, short interest, analyst ratings, institutional ownership, and international revenue exposure. Each of these metrics can impact performance, and some of them have been much more impactful than others over the last five weeks. See the report now along with everything else we’ve published recently by signing up for a new premium research membership below.
See the full B.I.G. Tips report by signing up for a monthly Bespoke Premium membership now. Click this link for a 10% discount ($89/month).
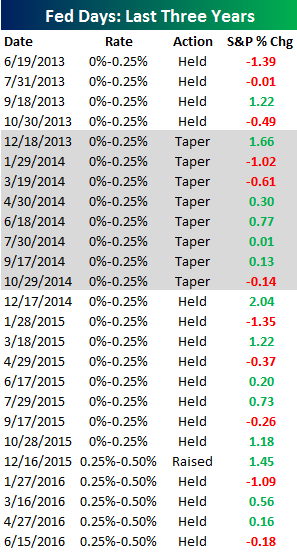
Jul 26, 2016
Earlier today, we sent Bespoke Premium and Bespoke Institutional members a brand new B.I.G. Tips report looking at historical market performance on Fed Days. Below is an abbreviated version of a table from the report that shows Fed Days over the last three years. You’d be amazed to see how the S&P 500 has done on Fed Days over the last 20 years. To see the stats, get signed up for a new Bespoke membership below!
See the full B.I.G. Tips report by signing up for a monthly Bespoke Premium membership now. Click this link for a 10% discount ($89/month).