Nov 8, 2016
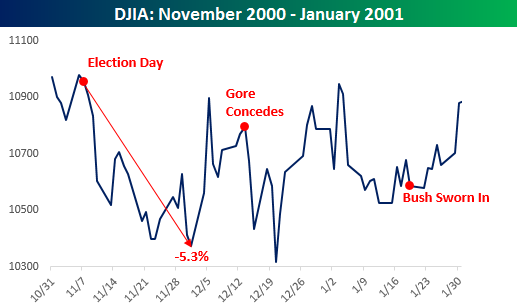 We just published a useful summary for clients of market returns in different sessions of Congress based on the political makeup of Washington, but what if the results of the vote are so close that we don’t have a winner tomorrow morning? Hopefully that isn’t the case (especially now that the Supreme Court is split right down the middle), but if that kind of scenario does unfold, the reaction of the markets likely wouldn’t be good. The chart to the right shows the performance of the DJIA following the 2000 election which wasn’t decided until well after Election Day. During that period of uncertainty, the DJIA declined 5.3% from the Election Day close to its low on 12/1/00. What is interesting to note, though, is that even with the uncertainty, on the day after the election in 2000, the DJIA only declined 45 points (0.41%). We can only imagine if that type of scenario played out this year, instead of a 45 point decline, we would be looking at a decline of more like 450 points.
If you are interested in seeing our latest B.I.G. Tips report, Looking Past Election Day, sign up for a monthly Bespoke Premium membership and get 10% off for life ($89/month). There is no financial obligation whatsoever, and you can cancel at any time.
Nov 3, 2016
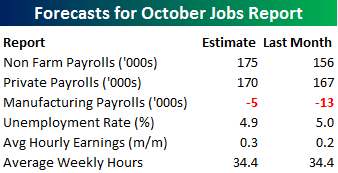 Heading into Friday’s Non Farm Payrolls (NFP) report for October, economists are expecting an increase in payrolls of 175K, which would be a 19K increase from last month’s weaker than expected reading of 156K. In the private sector, economists are expecting an increase of 170K, which would be a similar improvement as the overall headline reading. The unemployment rate is forecasted to improve slightly back down to 4.9% from last month’s reading of 5.0%. Growth in average hourly earnings is expected to accelerate back up to 0.3%, while hours worked is forecast to remain unchanged at 34.4. It’s still early, but data that we have seen so far covering the month of October has shown weaker momentum from September. Following Friday’s report, we should have a much better read on how economic activity is shaping up for the month of October.
With such high stakes surrounding the report, the market will likely have a big reaction to the upside or downside based on how the number comes in relative to expectations. To that end, we just published our eleven-page monthly preview for the October jobs report. This report contains a ton of analysis related to how the equity market has historically reacted to the monthly jobs report, as well as how secondary employment-related indicators we track looked in September. We also include a breakdown of how the initial reading for September typically comes in relative to expectations and how that ranks versus other months.
For anyone with more than a passing interest in how equities are impacted by economic data, this report is a must read. To see the report, sign up for a monthly Bespoke Premium membership and get 10% off for life ($89/month).
Nov 1, 2016
The S&P 500 fell 0.68% today to register its sixth consecutive decline. Today was also just the 16th time in the S&P’s 89-year history that it fell more than 0.50% on the first trading day of November.
In a B.I.G. Tips report just published for Premium and Institutional subscribers, we analyze prior six-day losing streaks and weak starts to November to see if the market typically continues lower or bounces back. We also provide commentary on the upcoming election and how to position ahead of next Tuesday. This report is a must-read for anyone looking for guidance after a rough few weeks for stocks.
To view our just-published B.I.G. Tips report titled “Six-Day Losing Streak as Election Looms,” sign up for a monthly Bespoke Premium membership and get 10% off for life ($89/month).
Nov 1, 2016
The last two months of 2016 certainly aren’t getting off to a very good start for anyone who is long equities. For the majority of managers out there who are already underperforming, a day like today only digs the hole a little deeper.
Through the first ten months of 2016, the two top performing sectors in the S&P 500 are Utilities and Energy. Right behind those two, Technology rounds out the top three and is the only other sector that saw a double-digit percentage gain through 10/31. On the downside, Health Care and Consumer Discretionary are the only two sectors in the red this year. Along with these two, the only other sector underperforming the S&P 500 YTD is Financials (+1.9%). Had you asked a random group of investors back in January which sectors would do the best and worst in 2016, we would bet that more people would have expected Utilities and Energy to be on the list of losers than winners. Conversely, at the end of 2015, Health Care (especially biotechs) and Consumer Discretionary were among two of the most loved sectors in the market.
Now that 2016 has essentially emasculated the confidence of most portfolio managers, heading into the last two months of the year, which sectors should investors be looking to add exposure to in order to outperform? Do the sectors that were already winning typically maintain their strength to close out the year, or do investors look to the losers for a rebound. In a B.I.G. Tips report just published for Premium and Institutional subscribers, we looked at sector returns going back to 1990 in order to see what patterns the best and worst performing sectors through 10/31 exhibit in the final two months of the year.
To view our just-published B.I.G. Tips report titled “Buy the Winning Sectors or the Losers?,” sign up for a monthly Bespoke Premium membership and get 10% off for life ($89/month).