B.I.G. Tips – February Employment Report Preview
Heading into Friday’s Non Farm Payrolls (NFP) report for February, economists are expecting an increase in payrolls of 205K, which would be a slight increase from January’s reading of 200K. In the private sector, economists are also expecting the same increase of 205K. With these increases, the unemployment rate is expected to fall to 4.0%. The big area of focus, however, will come from average hourly earnings. You may recall that in last month’s report, we saw a larger than expected increase, and that helped to exacerbate what was at the time a modest sell-off in equity prices. With that in mind, look for any signs of strength in wages to have an adverse impact on stock prices.

Ahead of the report, we just published our eleven-page monthly preview of the February jobs report. This report contains a ton of analysis related to how the equity market has historically reacted to the monthly jobs report, as well as how secondary employment-related indicators we track looked in February. We also include a breakdown of how the initial reading for February typically comes in relative to expectations and how that ranks versus other months.
One topic we cover in each month’s report is the S&P 500 stocks that do best and worst from the open to close on the day of the employment report based on whether or not the report comes in stronger or weaker than expected. In other words, which stocks should you buy, and which should you avoid? The table below highlights the best-performing stocks in the S&P 500 from the open to close on days when the Non-Farm Payrolls report has been weaker than expected over the last two years.
When the NFP report is weaker than expected, all of the 25 best-performing stocks in the S&P 500 have seen average open-close gains of more than 1%. NRG Energy (NRG) is the best performing stock in the S&P 500 with an average gain of 1.9% and gains 85% of the time. In terms of consistency, it doesn’t get any better than Sysco (SYY) which has been up from the open to close every time the NFP report has been weaker than expected.
For anyone with more than a passing interest in how equities are impacted by economic data, this report is a must-read. To see the report, sign up for a monthly Bespoke Premium membership now!

The Streak
Back in 1995, on a crisp fall September night, Cal Ripken Jr. did the previously unthinkable and broke one of the most enduring streaks in baseball history when his 2,131st straight game became official in the top of the fifth. That game surpassed the previous record of 2,130 straight games that was held by “The Iron Horse” Lou Gehrig and stood for over a half-century. Ripken’s streak continued another 501 games until 9/19/98 when he voluntarily sat out of what would have been his 2,633rd straight game. Because of the way the game is now played and how players are rested on a somewhat regular basis, there is widespread agreement that Ripken’s streak could stand forever.
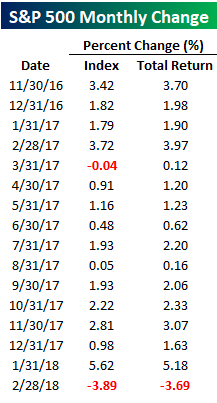
For the US equity market, there is another almost as impressive streak of consistency that could have set a record had we just managed to post a gain in February. February marked the first down month for the S&P 500 since March 2017 (ten straight months of gains). On a total return basis, though, the streak of gains was even more impressive at 15 straight months heading into February (right side column in the table below). The last time the index had a down month on a total return basis before February, Hillary Clinton was a shoe-in to be the next President. Just like President Clinton was on hand to watch as Ripken broke Gehrig’s streak, President Trump was likely watching this streak just as closely!
As mentioned above, the 15-month streak of consecutive monthly gains for the S&P 500 is quite an impressive one. Throughout history, there have only been a handful of prior streaks that even reached the double-digit range. In a B.I.G. Tips report we just published this morning, we looked at prior periods when similarly long streaks came to an end to see how the market tended to react. What we found was a clear trend in how equities performed going forward, and depending on your perspective, you’ll either love it or hate it.
If you’re interested in the report, you can read it by signing up for a Bespoke Premium membership now!