Feb 10, 2017
And you thought politics was crazy! After record high temperatures in the Northeast on Wednesday, Thursday brought a freak snowstorm that dumped more than a foot of snow in the tri-state area, grounding pretty much everything to a halt. After digging out the summer clothes Wednesday, shovels were the order of the day on Thursday. Through the weather and everything else, though, the stock market continued to serve as a rock of stability, steadily rising in what was a relatively uneventful week in terms of the market. After a small decline to start the week, the S&P 500 saw four straight days of gains for its longest winning streak of the year.
In our Bespoke Report a few weeks back, we highlighted the S&P 500’s stair-step pattern of the last year and how the recent pattern looked to be in the middle stages of completing the tread of a stair. With each day that the sideways pattern went on, an increasing number of pundits were busy writing off the so-called Trump rally. It only seems fitting that just when doubts over the sustainability of the rally reached their highest levels since the election, the S&P 500 broke out of its recent range to new all-time highs and forming a new riser in the stair step pattern. Wherever the rally stops, nobody knows, but when it ends it will be at precisely the point when everyone who called an end to the rally decides that the rally “now has legs.”
If you’d like to read our thoughts on recent performance plus the rest of this week’s Bespoke Report newsletter, take advantage of our one-month Bespoke Premium free trial offer. Sign up now at this page.
Have a great weekend!
Feb 3, 2017
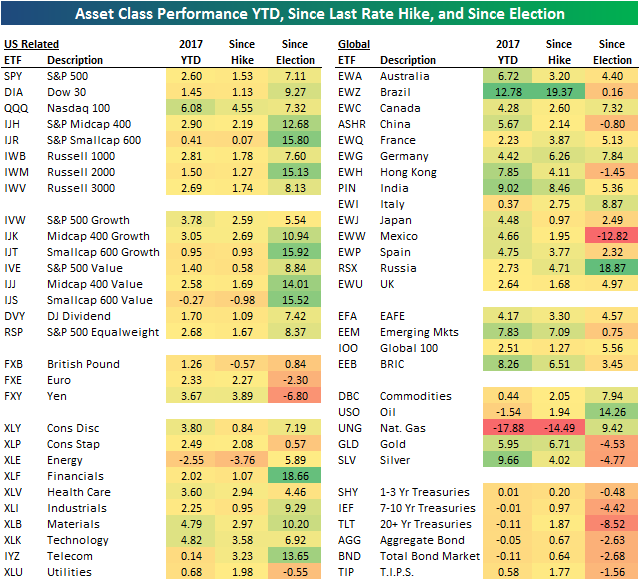
The screen below is one of many graphics included in our just-published Bespoke Report newsletter (included weekly with all of our membership packages). It shows the recent performance of various asset classes using our key ETF matrix.
If you’d like to read our thoughts on recent performance plus the rest of this week’s Bespoke Report newsletter, take advantage of our one-month Bespoke Premium free trial offer that includes our 2017 Outlook Report. Sign up now at this page.
Have a great weekend!
Jan 27, 2017
If you’re not yet a Bespoke subscriber, you can still get Bespoke’s 2017 Outlook Report with a 30-day free trial to Bespoke’s premium research! Click here to learn more.
The screen below is one of many graphics included in our just-published Bespoke Report newsletter (included weekly with all of our membership packages). As shown, we closed out the final full week of January with nearly all country ETFs trading above their 50-day moving averages. All but 7 of the 30 country ETFs in the screen are overbought. The post-election rally continues.

If you’d like to see the rest of this week’s Bespoke Report newsletter, take advantage of our one-month Bespoke Premium free trial offer that includes our 2017 Outlook Report. Sign up now at this page.
Have a great weekend!
Jan 20, 2017
If you’re not yet a Bespoke subscriber, you can still get Bespoke’s 2017 Outlook Report with a 30-day free trial to Bespoke’s premium research! Click here to learn more.
Eight years ago today, the presidency of what many called the most anti-business and anti-market candidate ever elected to the country’s highest office began. At the time of President Obama’s inauguration, for many, today couldn’t come soon enough. The consensus was that once his four years in office were done (because how could he ever be elected to a second term), the overall sentiment would be “good riddance.” As the saying goes, though, that’s why the play the game, because even when you think you have it all figured out, the outcome often looks different than what many expect.
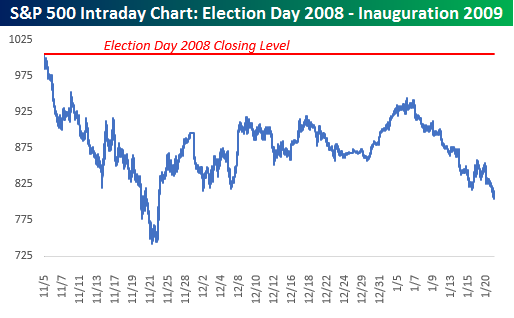 Right out of the gate after the 2008 election, stocks reacted negatively. On the day after Obama’s election in 2008, the S&P 500 declined over 5%, and it kept going down from there. At the intraday low in November, the S&P 500 lost more than a quarter of its value, in what was one of the steepest sell-offs in reaction to a Presidential election in market history. The market recovered a bit from there, but remained extremely volatile throughout the transition, but at the end of the day on his inauguration, the S&P 500 was still down 20% since he was elected. We would be remiss not to mention the fact that the US economy was in the middle of a Financial Crisis during this period so that was a big contributor to the market weakness, but the general perception from the markets was still that Obama would be bad for stocks.
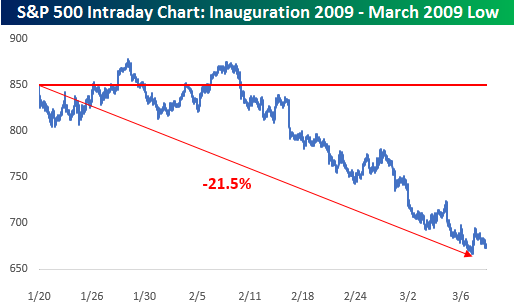 If Obama was hoping for a honeymoon once he came into office, he didn’t get it. While the first couple of weeks of his Presidency saw sideways trading, the bottom fell out of the market again in early February, falling over 21% through early March. At this point, investors were wondering how many bottoms there were to fall out of, while President Obama was probably watching the headlines pile up and wondering what he had gotten himself into!
If you’d like to see the rest of this week’s Bespoke Report newsletter, take advantage of our one-month Bespoke Premium free trial offer that includes our 2017 Outlook Report. Sign up now at this page.
Have a great weekend!
Jan 13, 2017
If you’re not yet a Bespoke subscriber, you can still get Bespoke’s 2017 Outlook Report with a 30-day free trial to Bespoke’s premium research! Click here to learn more.
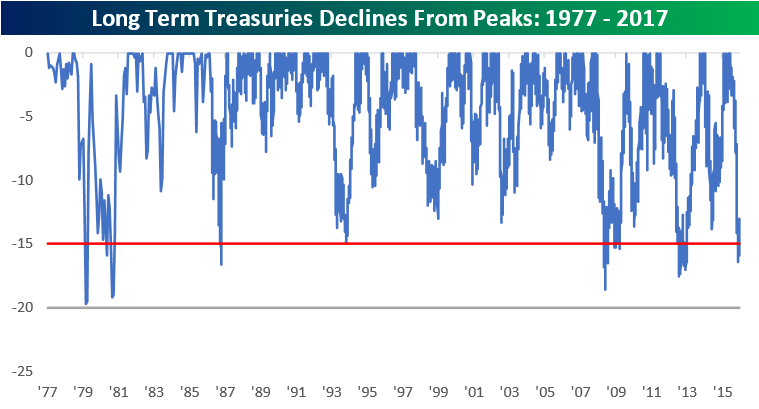
The chart below is included in this week’s Bespoke Report newsletter, which was just sent to Bespoke Premium subscribers. As shown, just when the pundits were telling everybody that interest rates across the treasury curve had nowhere to go but down, treasuries peaked and have since seen one of the steepest drawdowns from a peak on record. Among many of the topics covered in this week’s report was how treasuries and the S&P 500 have performed following prior drawdowns of similar magnitude.
If you’d like to see the rest of this week’s Bespoke Report newsletter, take advantage of our one-month Bespoke Premium free trial offer that includes our 2017 Outlook Report. Sign up now at this page.
Have a great weekend!
Jan 6, 2017
If you’re not yet a Bespoke subscriber, you can still get Bespoke’s 2017 Outlook Report with a 30-day free trial to Bespoke’s premium research! Click here to learn more.
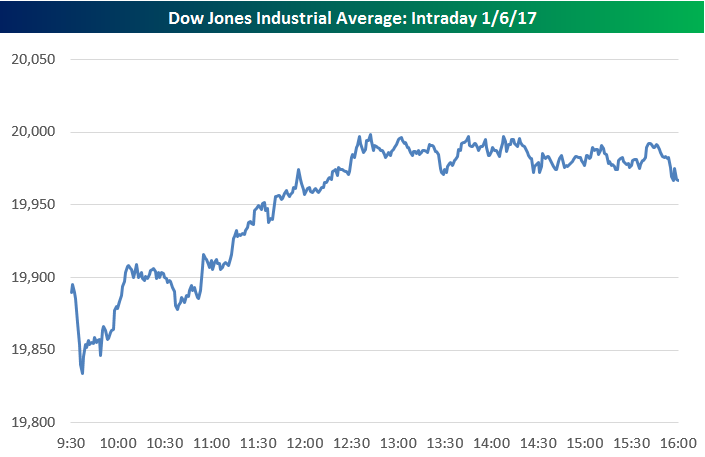
The chart below is included on page one of this week’s Bespoke Report newsletter, which was just sent to Bespoke Premium subscribers. Don’t tell traders that Dow 20,000 is just a meaningless number. While many like to mock the focus on big round numbers in the financial media, Friday’s action for the index shows that someone out there is using 20,000 as something more than just an arbitrary level. The chart highlights the intraday minute-by-minute action of the Dow Jones Industrial Average today. The closest the index had gotten to 20,000 prior to today was 19,987, but by mid-day Friday, it looked as if a cross of the 20,000 level was a shoe-in. It never happened, though.
All afternoon, the index got close to 20,000 — as close as 19,999.63 in fact — but every time it got near 20,000, sellers stepped in with force to not let it happen. It appears as if there are a large number of sell orders right at Dow 20,000. We’ll have to wait until Monday now to see if all of those sells are still in place.
Even though NYSE floor traders couldn’t wear their Dow 20,000 hats home for the weekend, it is important to note that all three major indices (Dow, S&P 500, Nasdaq) still hit new intraday highs today, which is quite a healthy sign for the market.
If you’d like to see the rest of this week’s Bespoke Report newsletter, take advantage of our one-month Bespoke Premium free trial offer that includes our 2017 Outlook Report. Sign up now at this page.
Have a great weekend!