Apr 24, 2026
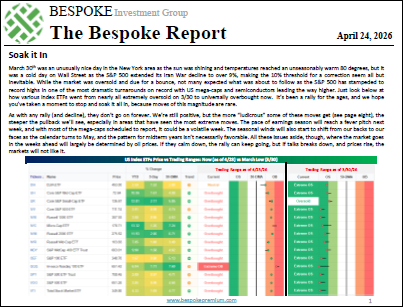
It’s been an incredible move off the lows from less than a month ago as certain areas of the market have seen historic rallies ahead of a busy week of earnings and economic data next week. How much more gas does the market have in its tank as some areas of the world worry about running out of oil? We cover it all in this week’s Bespoke Report.
To read this week’s newsletter and gain access to the rest of Bespoke’s daily research, start a 30-day trial to one of our three unique membership levels. CLICK HERE to sign up today!

Apr 17, 2026
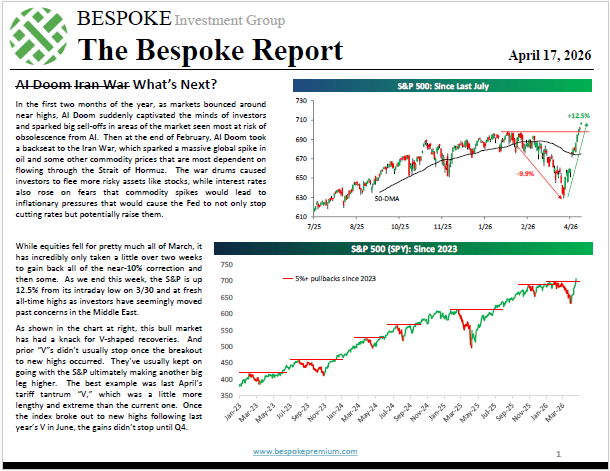
The S&P 500 fell more than 1% in each of the four full trading weeks of March, but the index has now risen 3%+ in each of the last three weeks.
The sharp move higher has left the index at fresh all-time highs.
In this week’s Bespoke Report, we cover the snapback rally that we’ve seen and how prior rapid reversals like this have eventually played out.
We also take a look at the upcoming earnings season, positive economic data, and the recent outperformance for international markets.
To read this week’s newsletter and gain access to the rest of Bespoke’s daily research, start a 30-day trial to one of our three unique membership levels. CLICK HERE to sign up today!
Apr 10, 2026
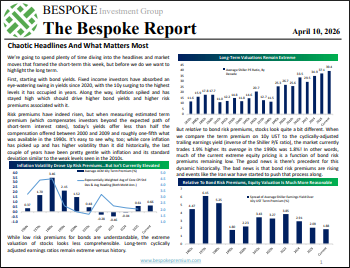
To read our weekly Bespoke Report newsletter and access everything else Bespoke’s research platform offers, start a two-week trial to Bespoke Premium. Hormuz remained closed this week but markets are working very hard to look past that fact given the huge surge in stocks and drop in energy futures. We go through the week’s chaotic headlines in detail, but keep our eye on other equity market drivers as well: economic data in the US and abroad, risk premiums (and return potential) offered by US stocks and bonds, the very strong performance of emerging markets, and the inflation outlook including the critical question of whether inflation expectations will remain anchored amidst this latest shock to consumer prices.
Apr 2, 2026
To read our weekly Bespoke Report newsletter and access everything else Bespoke’s research platform offers, start a two-week trial to Bespoke Premium. This week’s report comes a day early as the market is closed in observance of Good Friday. In this week’s report, we cover the market’s handcuff to oil prices, market performance during Q1, the extraordinary moves in the Energy sector, economic data since the war started, seasonality, and much more.
Mar 27, 2026
This week’s Bespoke Report is an updated version of our “Pros and Cons” edition for Q2 2026.
With this report, you’re able to get a complete picture of the bull and bear case for US stocks right now. It’s heavy on graphics and light on text, but we let the charts and tables do the talking.
On page three of the report, you’ll see a full list of the pros and cons that we lay out. Slides for each topic are then provided on page four and beyond.
To read this report and access everything else Bespoke’s research platform has to offer, start a trial to any of our three membership levels today!

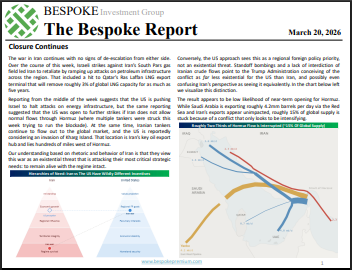
Mar 20, 2026
To read our weekly Bespoke Report newsletter and access everything else Bespoke’s research platform offers, start a two-week trial to Bespoke Premium. This week we are closely focused on the three week war in Iran and its consequences for energy markets and the economy. The conflict has driven a massive surge in energy stocks around the world with US refiners especially benefitting. But broad indices have plunged into deep oversold territory as stocks reel from a sudden and extreme shift in central bank pricing. We recap a long list of central bank decisions across emerging and developed markets as well as the chaos in bonds markets that spent the week waking up to the risks for interest rates of significant global petroleum shortages. We also review economic data, which this week showed an economy with surprisingly solid labor markets, healthy balance sheets, and accelerating inflation…even before the impacts of oil price surges.