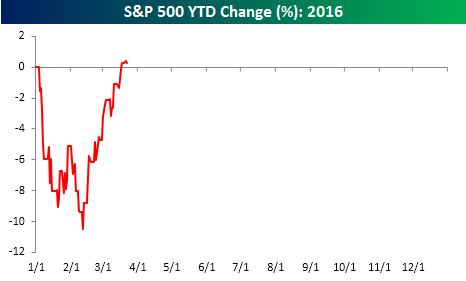
 With a year to date decline of 10.5% as of 2/11, and now a positive YTD return just six weeks later, it’s hard to imagine that there have been any years similar to 2016. At least in terms of market returns. As we have done in the past, though, today we ran our correlation analysis of the S&P 500’s day to day performance so far in 2016 to every other year since 1928. To perform this analysis, we compared the closing YTD prices of the S&P 500 on a daily basis through 3/22 this year to the closing YTD prices through 3/22 of every other year.
In a B.I.G. Tips report just sent to Bespoke Premium and Bespoke Institutional members, we highlighted the prior years with the closest correlation to 2016 and analyzed how the S&P 500 performed over the course of the remainder of those years.
See the full B.I.G. Tips report by signing up for a monthly Bespoke Premium membership now. Click this link for a 10% discount ($89/month).
