After a six-year rally of nearly 600%, the Biotech group finally broke down in 2015 when it peaked last July 20th. Currently, the group is down 29.3% from its all-time high, although at its lows in February it was down 38.8%. Biotech has made a series of higher lows (a positive formation) over the last 3.5 months, which is certainly a welcome sign. For the trend to really shift, however, Biotech needs to break out of the current downtrend channel that it’s stuck in.
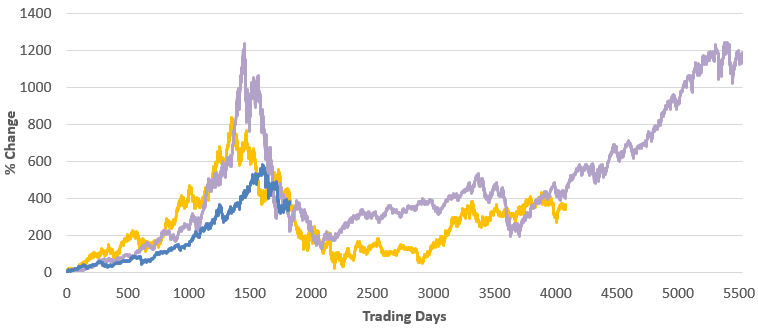
In a report sent to Bespoke Premium and Bespoke Institutional clients this morning, we compared the run that Biotech has had over the last few years to prior bubbles and busts that we’ve seen in other asset classes. Below is a chart from the report that may pique your interest. If you would like to see the full publication to get our thoughts on where Biotech has been and where it may be headed, please sign up for a monthly Bespoke Premium membership below!
See the full B.I.G. Tips report by signing up for a monthly Bespoke Premium membership now. Click this link for a 10% discount ($89/month).
