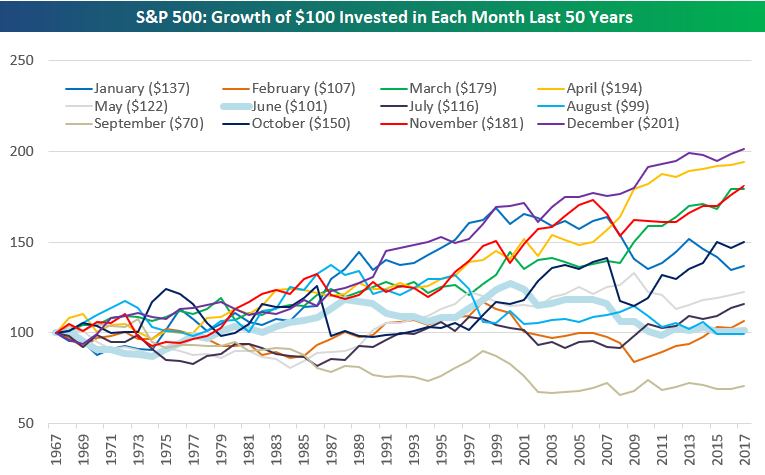
The chart below highlights the growth of $100 invested in the S&P 500 by month starting 50 years ago.
Had you only owned the S&P 500 during the month of August over the last 50 years, your $100 would now be $99 (for a decline of 1%). That’s not very good over a 50-year period! Historically, December has been the strongest month using this strategy, while the weakest month has been September, where $100 would now be worth just $70. Unfortunately, we have the two weakest months on the calendar coming up now that July is ending.
At the start of each month, we publish an in-depth report that analyzes seasonality trends for the US stock market, international markets, sectors, and individual stocks. To see which areas of the equity universe typically do the best and worst in the month of August, check out our just-published August Seasonality report.
This one is a must-read. To see it, sign up for a Bespoke Premium membership now!
