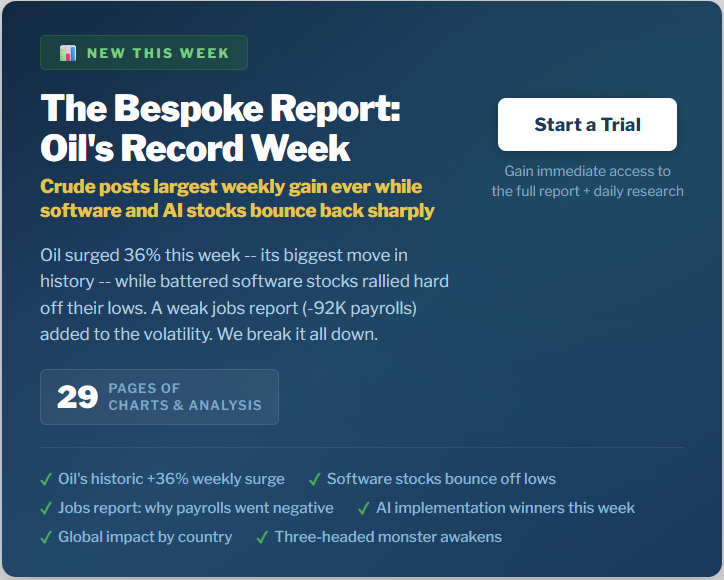
This Week’s Bespoke Report: Oil’s Record Week, Software’s Comeback, and the Iran Fallout
It was one of the wildest weeks in recent market history. Here’s a look at what we’re covering in this week’s Bespoke Report.
Oil Just Had Its Biggest Week Ever
Crude oil surged 36% this week, the largest weekly gain since at least 1985, after US/Israeli strikes on Iran effectively shut down tanker traffic through the Strait of Hormuz. By Friday afternoon, oil was trading above $91/barrel at its most overbought level in history. In the report, we look at what has historically happened to both oil and equities after spikes like this, and how quickly the pain is likely to show up at the gas pump.
Software Bounces Back
After falling more than 22% in the first two months of 2026, the iShares Expanded Tech-Software ETF (IGV) has rallied nearly 14% in just nine trading days with remarkably steady intraday buying pressure. The Citrini essay that terrified the sector on 2/22 may have marked the clearing-out event. It’s always easier to see in hindsight, but underneath all the snow on 2/23, there was plenty of blood on the software streets. We chart the bounce and put the current streak in historical context.
A Historic Reversal in Positioning
The Iran conflict triggered what looks like a broad deleveraging across institutional portfolios. Everything that worked in January and February stopped working this week, and everything that didn’t work started working. International equities that had been trouncing the US for months got hit the hardest, while the most beaten-down US stocks rallied sharply. We break down the reversal by asset class, country, and individual stock, and we explain why the US held up better than the rest of the world.
The Three-Headed Monster Awakens
Oil, Treasury yields, and the dollar. Our “three-headed monster” indicator just surged to its highest combined level in nearly a year. Two weeks ago, the monster was still asleep. We show where current readings sit relative to 40 years of history and what it has meant for forward equity returns.
Payrolls Go Negative
Friday’s jobs report showed a loss of 92,000 nonfarm payrolls, badly missing the +55K estimate. But the headline number is misleading. A big chunk of the weakness came from a single line item that will almost certainly reverse. We walk through what’s really going on beneath the surface, including what the data says about AI’s impact on younger workers.
The S&P 500 Keeps Bouncing
The S&P 500 opened down 1% or more on three separate days this week and managed to claw back each time. That’s only happened 13 times in SPY’s history since 1993. We look at where those prior weeks fell on the chart and what happened next.
That’s just a recap of some of the topics covered in this week’s Bespoke Report, our flagship weekly newsletter. This week’s edition is 29 pages of charts, tables, and in-depth analysis. If you’d like to dive in further, you can start a Bespoke trial to read the full report and get access to all of our daily research.