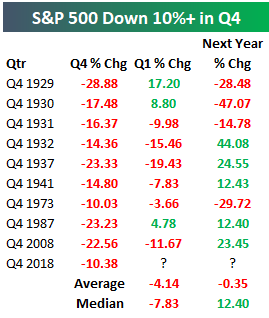
We’ve just published our weekly Bespoke Report newsletter for subscribers (learn more here). Below is one of many tables and charts featured in this week’s report. The table shows all years in which the S&P 500 fell 10%+ in the fourth quarter. As shown, Q4 2018 is tracking to be just the 10th time since 1928 that the S&P has fallen 10%+ in Q4. Not good. And unfortunately, when Q4s have been bad for the S&P, the following Q1s have been bad more often than not as well. For more in-depth analysis, start a free trial to any membership level and access the full Bespoke Report.