Feb 25, 2026
See what’s driving market performance around the world in today’s Morning Lineup. Bespoke’s Morning Lineup is the best way to start your trading day. Read it now by starting a two-week trial to Bespoke Premium. CLICK HERE to learn more and start your trial.
“To devastate is easier and more spectacular than to create.” – Anthony Burgess

Below is a snippet of commentary from today’s Morning Lineup. Start a two-week trial to Bespoke Premium to view the full report.
Equity markets are looking to build on yesterday’s turnaround Tuesday gains and are on pace to erase much of Monday’s losses, but whether these gains stick through the end of the week could depend on Nvidia’s (NVDA) report after the close. It’s widely assumed that the results will be strong, but will they be strong enough? And ff they’re too strong, will that also be interpreted as further future disruption in the software space?
Crude oil is higher this morning, trading just above $66 per barrel, even as Reuters reports that OPEC+ is considering a 137K barrel increase to daily production. Gold is also fractionally higher, back above $5,200 per ounce as silver surges 4% and platinum spikes 8%. Even bitcoin, yes bitcoin, is higher by more than 2%.
Asian stocks finished the day higher across the board, with the Nikkei up over 2% and South Korea up just under 2%. Chinese stocks also traded higher even as the Ministry of Commerce threatened to impose countertrade measures in response to the new tariff policies of the Trump Administration.
In Europe, stocks are also broadly higher but at a more restrained pace. The STOXX 600 is up 0.5%, led higher by 1% gains in Italy and the UK. Eurozone GDP fell more than expected (-0.6% vs -0.5% forecast) and German GDP was in line with expectations, growing 0.3% q/q.
Besides some important earnings reports after the close from NVDA and Salesforce (CRM), it’s a quiet day for data, but we will hear from many Fed speakers, including Barkin, Schmid, and Musalem.
Given the ongoing weakness we have seen in certain areas of the market, which investors now think will be devastated by AI, it’s still hard to believe how range-bound the S&P 500 has been. Yesterday, the S&P 500 closed less than 0.1% below its 50-day moving average. You can’t get much closer than that! And it wasn’t just yesterday. The rangebound morass has been going on for months now, as there hasn’t been a day in the last three months where the S&P 500 closed more than 2.5% above or below its 50-day moving average.
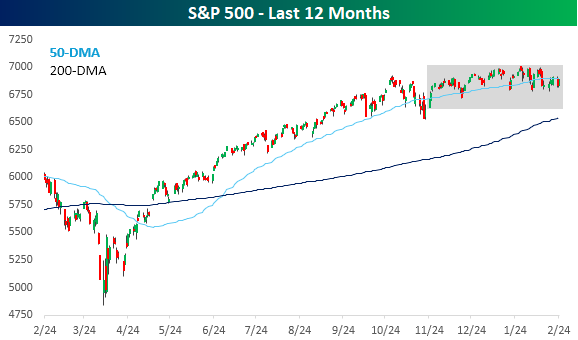
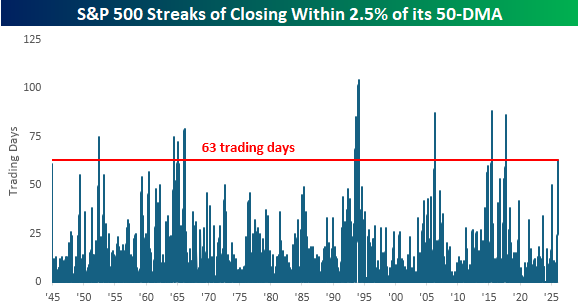
Periods where the S&P 500 has been so closely anchored to its 50-DMA haven’t been all that common throughout history. The chart below shows streaks when the S&P 500 closed within 2.5% of its 50-DMA (above or below), and the current streak, which reached three months (63 trading days) yesterday, is the longest since the first Trump administration in August 2017. Since WWII, there haven’t been many other extended periods where price was consistently so close to its 50-DMA.
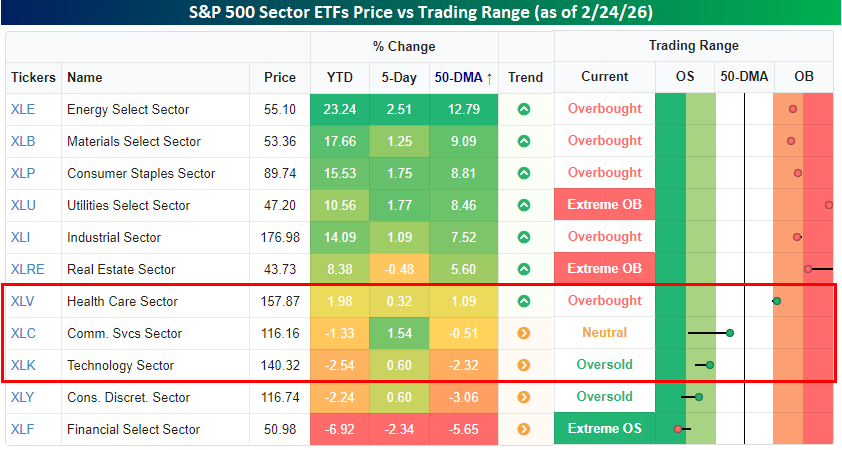
What makes the current streak even more incredible is that most sectors haven’t been showing the same pattern. As of yesterday’s close, just three of eleven S&P 500 sector ETFs – Health Care (XLV), Communication Services (XLC), and Technology (XLK) – closed within 2.5% of their 50-DMAs, and most sectors aren’t even close. Six are more than 5% above their 50-DMAs, and another is more than 5% below its 50-DMA. Like a sleeping volcano, the S&P 500 looks placid from above, but underground, the molten lava bubbles.
Feb 24, 2026
This content is for members only
Feb 24, 2026
See what’s driving market performance around the world in today’s Morning Lineup. Bespoke’s Morning Lineup is the best way to start your trading day. Read it now by starting a two-week trial to Bespoke Premium. CLICK HERE to learn more and start your trial.
“I don’t know what happened. It was just euphoria. I can’t even explain what I was feeling, just pure joy.” – Charlie McAvoy
Below is a snippet of commentary from today’s Morning Lineup. Start a two-week trial to Bespoke Premium to view the full report.
After trading uniformly higher earlier, equity futures are mixed this morning, with the S&P 500 fractionally lower, while the Nasdaq is higher. Investors are still reeling from yesterday’s tech sell-off, as markets start to think that AI-disruption will negatively impact just about every business and sector. Treasury yields are little changed, but at 4.03%, the 10-year yield is near the low end of its range. Crude oil is modestly higher but still hovering around $66 per barrel, while gold is down over 1% and Bitcoin is down another 2% and barely hanging on to $63,000.
In Asia, Japan, South Korea, and China were all firmly higher as the latter returned from the Lunar New Year holiday, while India and Hong Kong were both down over 1%. In Europe, trading has been directionless in early trading with the STOXX up 0.2%, but at the country level, performance has varied between gains and losses.
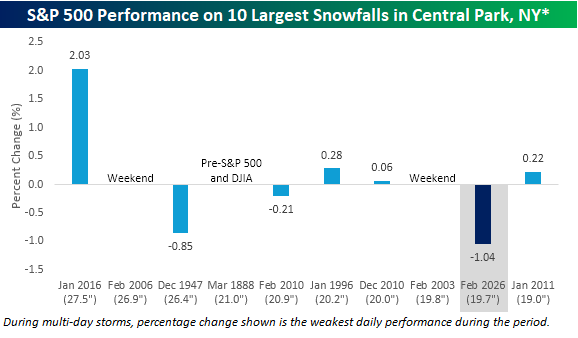
Let’s start with yesterday’s blizzard in the Northeast. With 19.7 inches of snow in New York’s Central Park, it was the ninth-largest snowfall in New York City history. While travel bans were in place around the New York tri-state area, the bears had no trouble getting to work. With the S&P 500 down 1.04%, it was the worst single-day performance for the S&P 500 during one of its ten-largest snowstorms on record. As shown in the chart below, during the prior top ten snowstorms for New York City, the weakest single-day performance during one of these snowstorms was a decline of 0.85% on 12/26/1947.
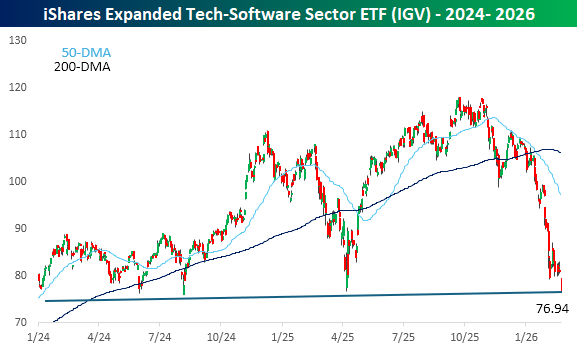
As it has been for some time, the software sector was responsible for much of yesterday’s weakness. The iShares Expanded Tech-Software Sector ETF (IGV) fell close to 5% and to its lowest level on an intraday basis since August 2024 as the lows from earlier this month broke like a hot knife through butter.
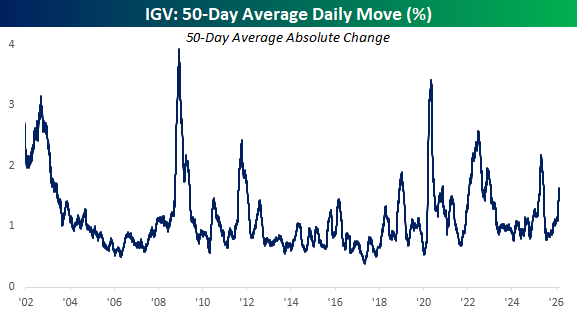
While software has been weak, it hasn’t necessarily been as volatile as you would expect. Over the last 50 trading days, IGV’s average daily change has been a gain or loss of 1.6%. While that’s elevated, it’s hardly anywhere near a historical extreme. Even in early 2025, the average daily change was much higher at over 2%.
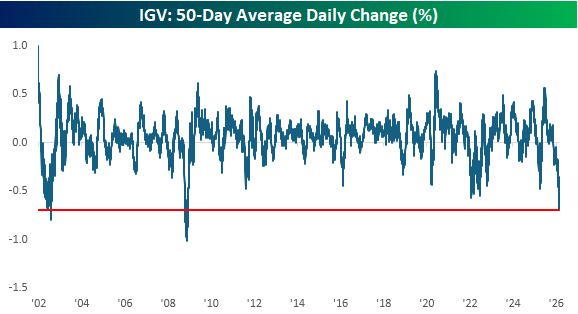
Where the moves in IGV have been extreme, though, is in terms of the average daily percentage change (not the absolute daily change but the average of the trailing 50-day changes). As of yesterday’s close, IGV’s average daily change was a decline of 0.69%, which ranks as one of the most negative readings in the ETF’s history. In fact, the only times that IGV was more of a one-way trade to the downside were during the Financial Crisis and at the end of the dot-com bust.
Feb 23, 2026
See what’s driving market performance around the world in today’s Morning Lineup. Bespoke’s Morning Lineup is the best way to start your trading day. Read it now by starting a two-week trial to Bespoke Premium. CLICK HERE to learn more and start your trial.
“I don’t know what happened. It was just euphoria. I can’t even explain what I was feeling, just pure joy.” – Charlie McAvoy
Below is a snippet of commentary from today’s Morning Lineup. Start a two-week trial to Bespoke Premium to view the full report.
Confusion regarding the state of global trade following Friday’s Supreme Court decision striking down the President’s reciprocal tariffs has futures lower to kick off the week. The fact that some form of armed conflict with Iran looks increasingly likely also hasn’t helped. As if that weren’t enough, while the blizzard in the northeast doesn’t have any direct market impact right now, it has effectively paralyzed a central area of economic activity for the day, and air traffic, so it will have some economic impact as well. Crude oil is fractionally higher at close to $67 per barrel; gold is up 2% and looks to be making a new run at its January highs; and silver is up over 5%. Bitcoin, however, is down 2% as some investors are starting to question whether it’s even an effective store of value anymore.
Overnight in Asia, China remains closed for the Lunar New Year, and Japan is also closed, but South Korean stocks traded up nearly 1%, which nowadays doesn’t even register as an impressive move. In Europe, the STOXX 600 is down modestly in a mixed session where Italy and Spain are both up roughly 1% while Germany dips about 0.5%. The disparate performances stem from strength in banks and weakness in industrials (more German-focused).
Datawise, there’s not a lot on the calendar today. At 8:30, we got the Chicago Fed National Activity Index. That will be followed by Factory Orders at 10, and the Dallas Fed at 10:30. Fed Governor Waller is also speaking this morning, and he’s on the wires saying that a March rate cut will depend on the state of the labor market, which he sees as likely remaining weak going forward, citing potential pressures from AI.
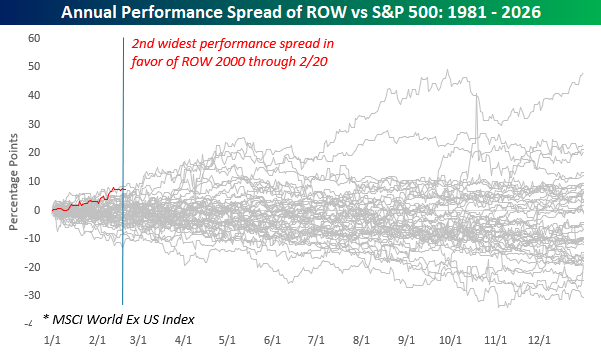
The US is on top of the hockey world this morning after Sunday’s dramatic OT win, and investors are hoping some of those gold-medal vibes rub off on the stock market. As we highlighted in Friday’s Bespoke Report, through the first several weeks of 2026, US stocks have underperformed stocks from the rest of the world to a near-historic degree. As shown in the chart below, the only year since 1980 when the S&P 500 underperformed the rest of the world by a wider margin was in 1984, and barely at that.
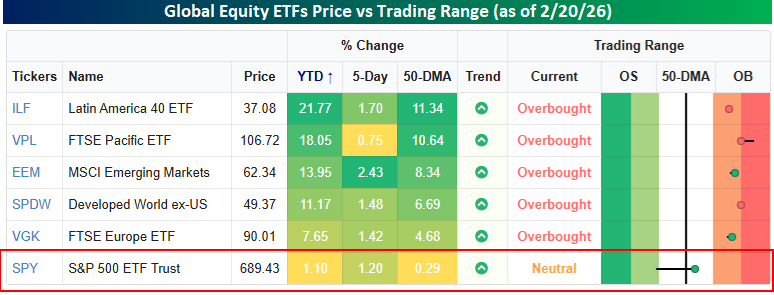
The graphic below puts the short-term US underperformance into even better perspective. Major international regional equity ETFs headed into the weekend on power plays at overbought levels (1+ standard deviation above their 50-DMAs), while the US was short-handed in penalty-killing mode and scrapping to get back above its 50-day moving average. YTD, European equities, as measured by the FTSE Europe ETF (VGK) were outperforming the S&P 500 by more than six full percentage points, but the other four regional ETFs shown were all outperforming by at least 10 full percentage points, with Latin America (ILF) outperforming by 20 percentage points – in less than two months! How the lines have shifted!
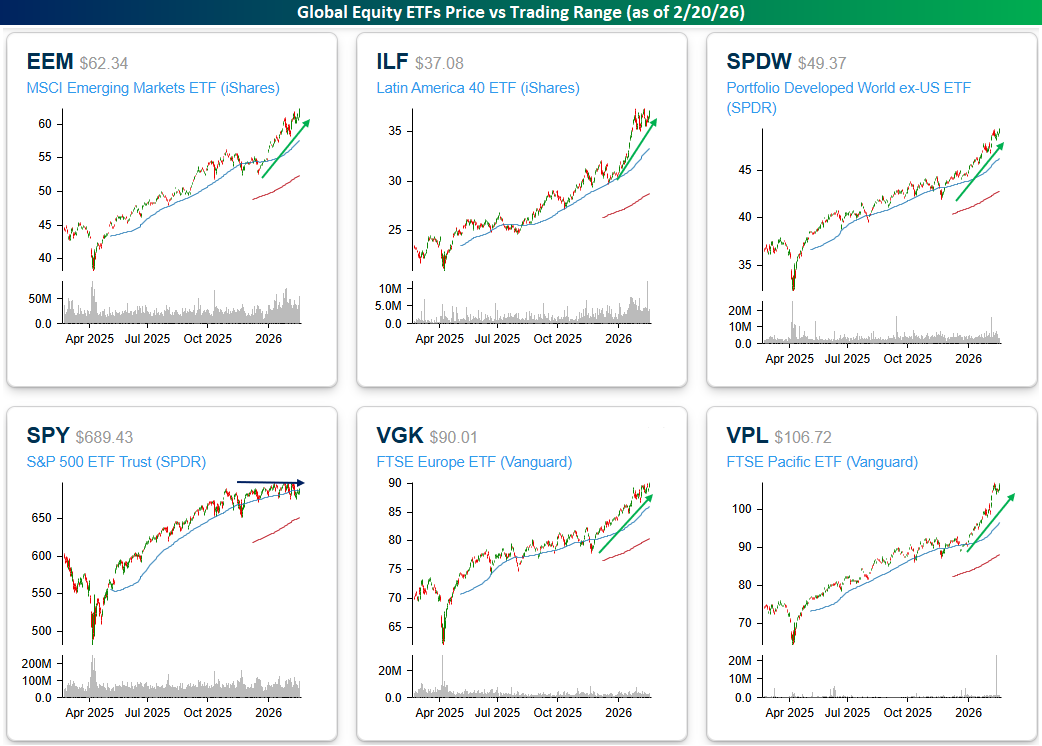
A look at the six price charts also shows the disparity between US and international stocks. Five of the charts shown are in clear, well-defined uptrends, while the US has been stuck in neutral between the blue lines, unable to push the puck into the zone, but also successfully fighting off any bearish attacks into their defensive zone.
Feb 20, 2026
Four months ago, the S&P 500 had rallied more than 35% off its tariff-tantrum lows from six months earlier in one of the most impressive rallies we’ve ever seen. The S&P 500 and just about every other US equity index was trading at short-term overbought levels, though, and prominent strategists and investors advised that the market needed to pause and digest the big gains. The rally also needed to broaden as mega-caps couldn’t lead forever.
Well, we got what we wanted.
Read this week’s Bespoke Report newsletter and gain access to the rest of our product suite with a Bespoke trial. CLICK HERE or on the image below to proceed.