Mar 6, 2026
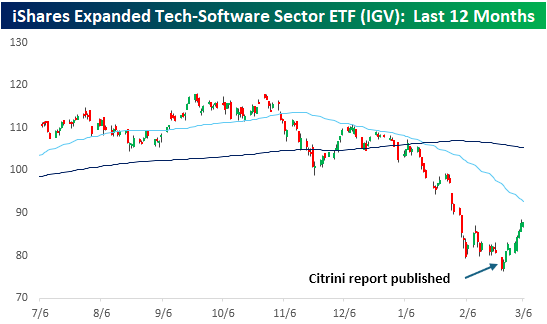
The first two months of the year were a year to forget for the software sector. In just two months, the iShares Expanded Tech-Software Sector ETF (IGV) fell more than 22%, taking its total decline from its peak to over 30%. In the early weeks of 2026, it seemed as though every weekend a new negative article about the sector was published, allowing nervous investors to worry all weekend about the death of software stocks at the hands of AI.
The most notable of these reports, so far, was the Citrini essay titled “The 2028 Global Intelligence Crisis”. Published on 2/22, it also coincided with a weekend blizzard in the northeast. When the markets opened for trading the following Monday on 2/23, the magnitude of the decline was likely exaggerated given the lower market liquidity. Looking back at that report, though, in the short-term at least, its publication appears to have been a clearing-out event for the market, as IGV has rallied 13.9% since the close on 2/23.
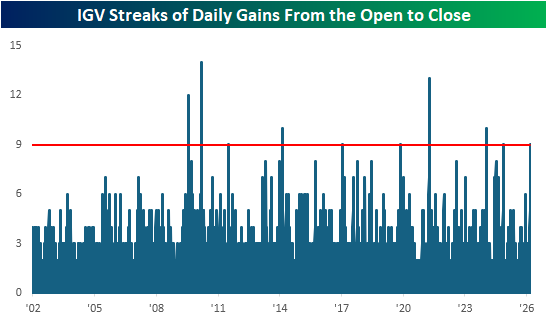
Over the course of that 13% rally, IGV has traded higher in eight of the last nine trading days, including today’s fractional gain as of midday. Not only has IGV traded consistently higher, but there has also been steady buying throughout the trading day. In each of those nine days, even on the one day it traded lower, IGV traded higher from the open to close. While there have been five other streaks where IGV had more consecutive days of gains from the open to close, the current streak is tied with four other periods for the sixth-longest streak in the ETF’s history. It’s always easier to see in hindsight, but underneath all the snow on 2/23, there was plenty of blood on the software streets.
Like this analysis? Join our premium members by starting a trial today! Click below for details on how to sign up:

Mar 6, 2026
See what’s driving market performance around the world in today’s Morning Lineup. Bespoke’s Morning Lineup is the best way to start your trading day. Read it now by starting a two-week trial to Bespoke Premium. CLICK HERE to learn more and start your trial.
“I never worry about the problem. I worry about the solution.” – Shaquille O’Neal

Below is a snippet of commentary from today’s Morning Lineup. Start a two-week trial to Bespoke Premium to view the full report.
Did you know that there’s an employment report today? With geo-politics in the forefront, economic data has largely taken a back seat this week, but the data will keep coming (unless there’s a shutdown, of course!), and heading into this morning’s report, the S&P 500 and Nasdaq are indicated to open down by between 0.75% and 1.0%, continuing a week of lousy market action. Treasury yields are higher, crude oil is surging, and gold is fractionally higher.
In Asia, most major indices were flat to lower, but still finished the week sharply lower, with the Nikkei down 5.5%, China down 2.1%, and South Korea down more than 10%. In Europe, the losses are even larger, with the STOXX 600 down over 1%, taking its decline for the week to over 5%. Across the continent, every major benchmark is down over 5% this week.
Besides the Employment report, Retail Sales also hit the tape at 8:30. The employment report was a disappointment across the board as Non Farm Payrolls fell 92K versus forecasts for an increase of 55K, and the Unemployment Rate increased to 4.4% versus forecasts for 4.3%. Average hourly earnings were slightly higher than expected, rising 0.4% versus forecasts for an increase of 0.3%. As bad as that report was, it will be interesting to see if there were any weather-related impacts. While the jobs picture was weaker, Retail Sales came in better than expected.
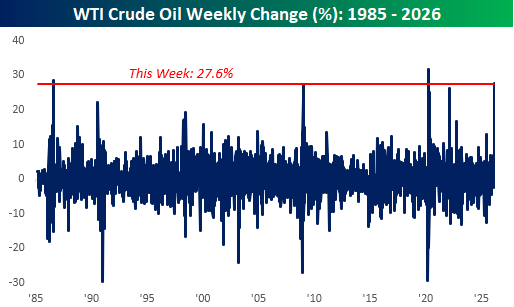
When markets opened for trading on Monday, and crude oil prices rallied a bit over 5%, it was viewed as a surprisingly muted reaction to a monumental event in the Middle East. It looked like we got off easy. As the days have gone on and the conflict has continued, crude oil prices rose every day this week with a 4.7% gain on Tuesday, a 0.1% gain on Wednesday, an 8.5% gain on Thursday, and what’s shaping up to be a 6.5% gain today. The frogs in the market pot had no idea what was coming.
Adding them all together, WTI is on pace for a 27.6% gain this week, which would rank as the third-largest weekly gain since at least 1985. The only two larger gains were 31% in early April 2020 during Covid and 28.4% in August 1986 when OPEC announced a surprise production cut. One-week rallies of this magnitude aren’t very common.
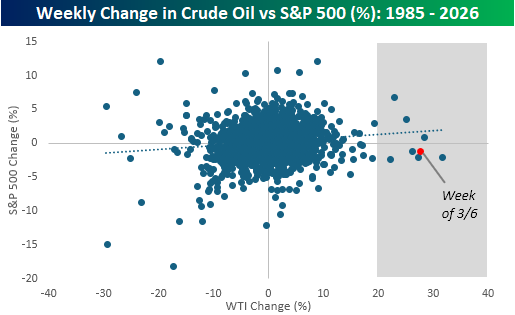
With oil prices up so sharply, it’s not surprising that equities have been under pressure, but looking at past moves shows that the inverse relationship isn’t as strong as you would think. The chart below compares the weekly change in crude oil to the S&P 500 going back to 1985, and there’s little correlation between the weekly direction of crude oil prices and the S&P 500. If anything, the correlation is slightly positive.
The shaded area includes each of the prior weeks when crude oil prices were up 20%, and of the seven occurrences, the S&P 500 was up three times and down four. For all seven weeks, the S&P 500’s median decline was 1.2%. Based on where futures are trading right now, guess how much the S&P 500 is down this week? 1.2%!
Mar 5, 2026
See what’s driving market performance around the world in today’s Morning Lineup. Bespoke’s Morning Lineup is the best way to start your trading day. Read it now by starting a two-week trial to Bespoke Premium. CLICK HERE to learn more and start your trial.
“The world makes much less sense than you think.” – Daniel Kahneman
Below is a snippet of commentary from today’s Morning Lineup. Start a two-week trial to Bespoke Premium to view the full report.
The S&P 500 crept into positive territory for the week, which was incredible given the circumstances, but futures are set to erase those gains at the open. Both the S&P 500 and Nasdaq are indicated to open down by 0.25%. The biggest driver of weakness is crude oil, where prices are up another 3% to $77. It’s simple at this point: the more crude oil rises, the bigger a headwind it will be for equities.
In Asia, stocks were higher across the board, with the biggest gains coming from South Korea, where the KOSPI rallied 9.6% following the 12% decline on Wednesday. Talk about a rational market! In Europe, the tone is less positive. While markets in the region started the day higher, they have been giving up those gains as the UP open approaches and are now all broadly looking at modest declines.
It’s been a busy morning for economic data, and most of it was better than expected. Initial jobless claims were slightly weaker than expected, and continuing claims were modestly higher. Import Prices were lower than expected, while both Non-Farm Productivity and Unit Labor Costs came in higher than expected.
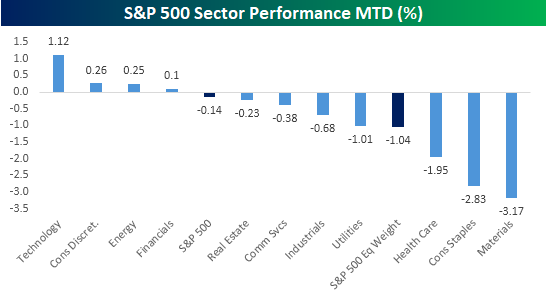
We’re less than a week into the war in Iran, but it’s never too early to see what trends within the equity market may be starting to emerge. At the sector level, you would expect to see a rush into defensive areas as investors rein in risk at the expense of cyclicals. So far, we’ve seen nearly the opposite play out. While the S&P 500 is up so far this week, which is surprising in itself, the four sectors outperforming the market are Technology, Consumer Discretionary, Energy, and Financials. If you had asked most people what sectors would outperform the market following a full-scale breakout of war in the Middle East, the only one of those four sectors that would come to mind is Energy.
The sectors you would expect to outperform in the event of war would be defensives like Utilities, Consumer Staples, and Health Care. But guess what? They’re three of the four worst-performing sectors with declines of at least 1% each! While the S&P 500 is surprisingly higher this week, the rally is primarily due to the 1%+ gain in the Technology sector. On an equal weight basis, the index is down 1.04%, and 60% of its components are down MTD.
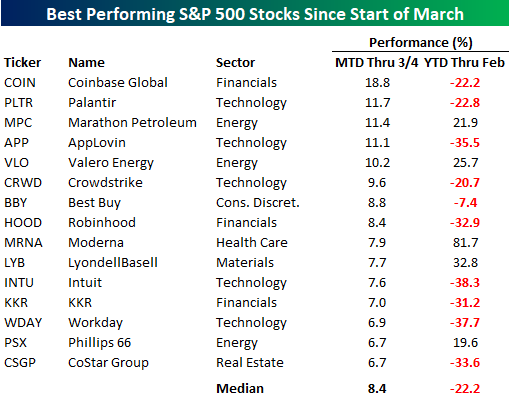
At the individual stock level, the list of winners is mostly devoid of defensive stocks. Instead, it’s littered with stocks that were recently considered some of the hottest growth stocks in the market before falling on hard times in late 2025 and earlier this year. Of the 15 top-performing stocks in the S&P 500 since the war broke out, their average YTD change in the first two months of the year was a decline of 22.2%, and ten of them were in the red. The two top-performing stocks – Coinbase (COIN) and Palantir (PLTR) – were both down over 20% in the first two months of 2026. While PLTR, with its military contracts, benefits from geopolitical instability, it’s hard to look at most of the other non-Energy stocks and see the obvious reason as to why they would benefit.
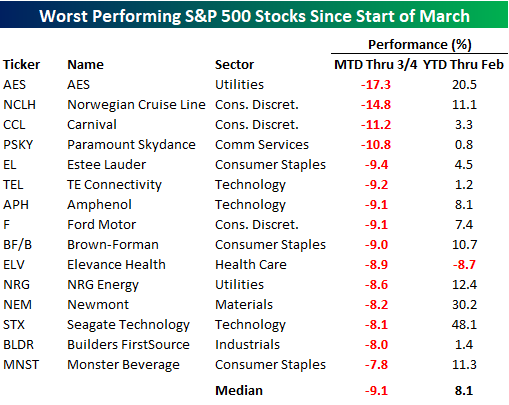
While the list of winners is mostly stocks that were down sharply YTD, all but one of the stocks on the list of losers were up YTD heading into March. Their average YTD gain was 8.1%, and seven were up by double-digit percentages. Leading the way lower, AES was up 20%+ YTD heading into March, but it has given most of that back in the first few days of March. Behind AES, cruise operators Norwegian Cruise Line (NCLH) and Carnival (CCL), along with Paramount Skydance (PSKY), are the only other stocks down by double-digit percentages. The declines in NCLH and CCL make sense given the geopolitical uncertainty, but the drop in PSKY is company-specific and tied to the merger with Warner.
Looking both at sector and individual stock performance since the war broke out, it seems as though investors have taken a back-to-basics approach, focusing on what had been working rather than what was working at the time that hostilities broke out. Whether that’s due to trade unwinds and short-covering given the heightened uncertainty or a reversion to tech remains to be seen, but in the early going, market performance and internals have done what they always do – surprise nearly everyone.
Mar 4, 2026
See what’s driving market performance around the world in today’s Morning Lineup. Bespoke’s Morning Lineup is the best way to start your trading day. Read it now by starting a two-week trial to Bespoke Premium. CLICK HERE to learn more and start your trial.
“In wartime, truth is so precious that she should always be attended by a bodyguard of lies.” – Winston Churchill
Below is a snippet of commentary from today’s Morning Lineup. Start a two-week trial to Bespoke Premium to view the full report.
It’s been an up-and-down overnight session for US equity indices, and as we type this now, both the S&P 500 and Nasdaq futures are basically flat with moves of less than 10 bps to the upside. Treasury yields are slightly higher, crude oil is flat, and gold is up less than 1%. Pretty quiet day, huh?
Iran will have the potential to continue dominating market action for the day, but don’t forget about the ADP Employment report, ISM Services, and then Broadcom (AVGO) earnings after the close. Earlier this week, the ISM Manufacturing report had the highest Prices Paid reading since 2022, so that will be a key metric to watch in today’s report for the services sector.
The bottom fell out of Asian stocks overnight as the Nikkei fell 3.6%, and every other major benchmark index in the region fell at least 1%. The real damage, though, was in South Korea, where the KOSPI fell over 12% for its worst day on record. There have been major market panics over the last 40 to 50 years, but none of them featured a day when South Korean stocks had a worse one-day decline. Fallout from the war in Iran was the primary driver of the declines, but Chinese PMI data for the Manufacturing and Services sectors also came in weaker than expected.
European stocks are following a different path than Asia, as the STOXX 600 is up over 1%, and the only major country up by less than 1% is the UK. Spanish stocks have managed a gain of 1.4% despite threats from the Trump Administration to cut off trade with the country. Service sector PMIs for the Eurozone and individual countries were basically in line with or slightly better than expected.
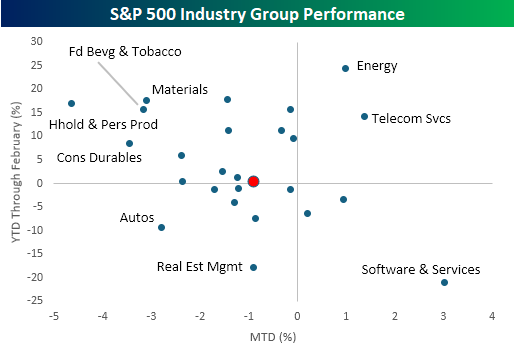
After two full sessions of trading since the war in Iran started, the overall market reaction has been subdued, but there have been some larger moves among individual industry groups. While the S&P 500 is down less than 1%, 16 out of 25 industry groups are up or down more than 1%.
This morning, we wanted to focus on some of the extremes. Starting with the winners that have continued winning, the only two groups that were up YTD heading into the conflict and have continued higher since are Energy and Telecom Services. Along with those two groups, the only others that are up this week are Software & Services (3.0%), which took the opposite path of South Korea by going from worst to first, Commercial Services (0.9%), and Banks (0.2%).
To the downside, some of the worst-performing sectors this week were some of the best YTD performers heading into the conflict. Household & Personal Products, Food Beverages & Tobacco, and Materials were all up over 15% YTD heading into the week, and they’re all down over 3% this week. As painful as the declines may feel this week, they’re coming off of a high base. It’s also worth noting that while Software stocks have bounced, Autos and Real Estate Management- the second and third worst performing groups YTD heading into the conflict have continued lower.
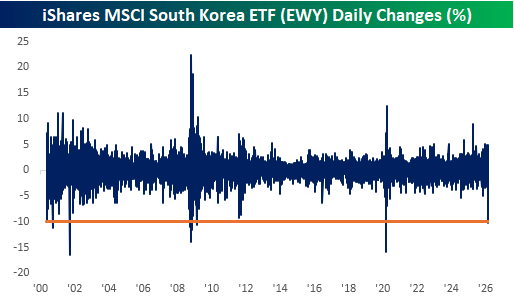
Outside of the US, we’ve also seen some major reversals this week. In yesterday’s Chart of the Day, we noted the outperformance of US stocks relative to the rest of the world. Nowhere has this reversal been more evident than in the performance of South Korean stocks. On Monday, the iShares MSCI South Korea ETF (EWY) fell more than 10% for its largest one-day decline since the Covid crash (South Korea’s KOSPI last night had its worst day on record). As shown in the chart below, declines of this magnitude have only been seen during periods of major crises like Covid, the Financial Crisis, and the dotcom bust.
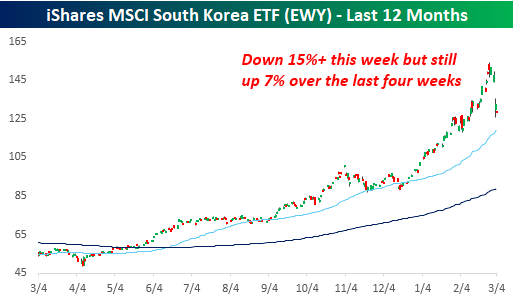
Besides Monday’s decline, EWY continued lower yesterday and is indicated down by another 3% this morning. That takes its decline this week to over 15%, and as sharp as that may sound, the ETF is still up over 7% in the last four weeks. It’s been a rocky few sessions, but if someone told you four weeks ago that you’d have a 7% gain in a month despite a major war in the Middle East, who wouldn’t have signed up for that?
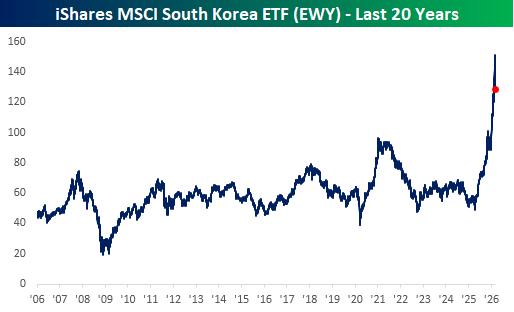
From a longer-term perspective, EWY still looks extremely extended relative to its historical range. After breaking out above its 2021 highs late last year, it is still up over 32% YTD, making it the top-performing major country ETF, so it’s hardly oversold.
Mar 3, 2026
This content is for members only