Jul 22, 2025
See what’s driving market performance around the world in today’s Morning Lineup. Bespoke’s Morning Lineup is the best way to start your trading day. Read it now by starting a two-week trial to Bespoke Premium. CLICK HERE to learn more and start your trial.
“My buddies wanted to be firemen, farmers or policemen, something like that. Not me, I just wanted to steal people’s money!” – John Dillinger

Below is a snippet of commentary from today’s Morning Lineup. Start a two-week trial to Bespoke Premium to view the full report.
There’s a negative bias in equity futures this morning as investors digest what has been a monster run, especially in some of the more speculative areas of the market. You can’t fault investors for taking a step back to catch their breath as earnings season picks up and we approach the August 1st tariff deadlines. Treasury Secretary Scott Bessent stated in an interview this morning that August 1st is a firm deadline, after which tariff rates will revert to the April levels for any country where a deal has not been reached. Once again, the Treasury Secretary is promising lots of deals, but so far, there has been little substance.
European stocks are also weak again this morning, with the STOXX 600 down 0.6% with Germany leading the way lower with a decline of 1%. In Asia, equities had a more mixed showing with Japan down fractionally (after being closed yesterday) while China finished about 0.5% higher.
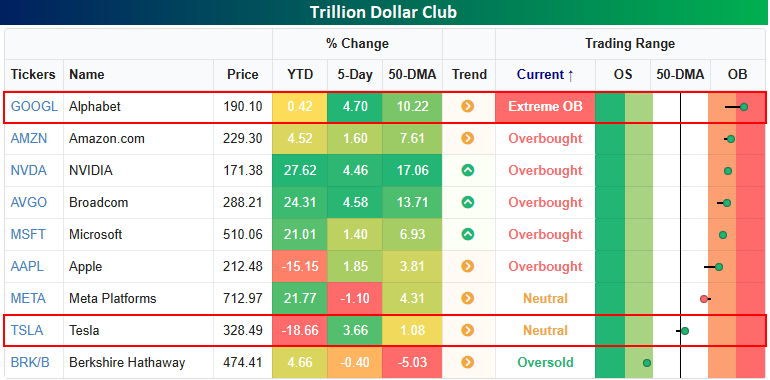
We’re in the second full week of earnings season, but the first of the big guns will kick things off tomorrow when Alphabet (GOOGL) and Tesla (TSLA) report after the close. In TSLA’s case, the stock is down nearly 20% on the year and closed yesterday just barely above its 50-day moving average, so expectations for the stock are pretty low. GOOGL is a bit of a different story. Of the now nine stocks with trillion-dollar market caps (a trillion isn’t what it used to be!), GOOGL is the only one trading at ‘extreme’ overbought (2+ standard deviations above its 50-DMA) levels, so on a short-term basis, expectations for the stock are on the high side. Longer-term, however, GOOGL has been an underperformer this year, with just a fractional gain, making it the third-worst performer of the “Noble Nine”.
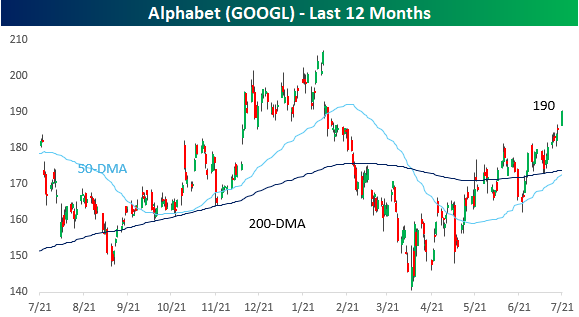
Looking specifically at GOOGL, even with the stock trading at extreme overbought levels, it remains right in the middle of the range it has occupied for the last year, with a low end just below $150 and a high end at just above $200. While GOOGL was the first mega-cap to brand itself as an AI-first company, the stock has been a battleground between those who say it missed the boat on AI and those who say it’s just taking its time.
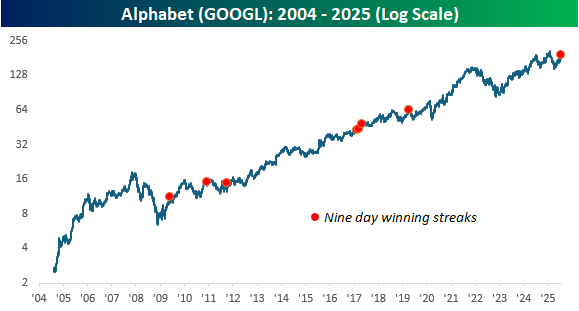
Besides closing at extreme overbought levels yesterday, GOOGL also finished the day higher for the ninth day in a row. That’s just one day shy of the longest streak in the stock’s history since its IPO in 2004 and the longest winning streak in more than six years.
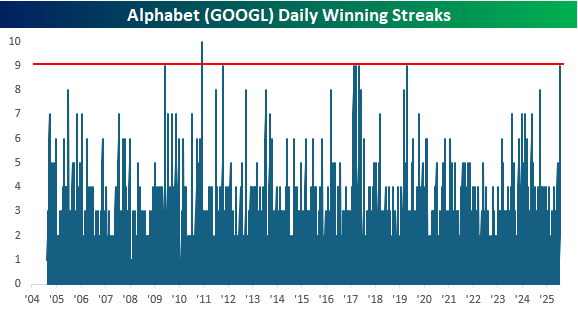
The chart below shows the long-term performance of GOOGL with each red dot indicating a 9-day winning streak. While none of these streaks occurred at or near a long-term peak in the stock (there haven’t been many), many occurred near a short-term peak.
Jul 21, 2025
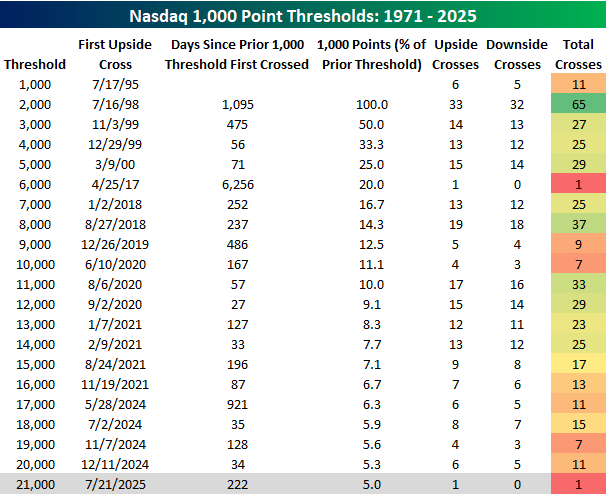
For the first time this year but the third time since the 2024 election, the Nasdaq Composite is on the cusp of closing above another 1,000-point threshold as the index crossed 21,000 for the first time earlier today. In the table below, we list the date that the Nasdaq first closed above each 1,000-point threshold since first closing above four-digit territory 30 years ago in July 1995.
After first closing above 1,000 in July 1995, it took another three years for the Nasdaq to breach the 2,000 level, but 1,000 points for the Nasdaq isn’t what it used to be. Back then, the Nasdaq had to double to get from 1,000 to 2,000, but the latest 1,000 points required a gain of just 5%.
Of all the different 1,000-point thresholds, the only one the Nasdaq crossed and never looked back from was 6,000 in April 2017. That was also the 1,000-point threshold with the longest span between crosses as it took more than 17 years to get there. At the other extreme, the 1,000-point threshold with the most crosses was 2,000 with 65, while the shortest span between different 1,000-point levels was the 27 days it took to cross from 11,000 to 12,000 in the summer of 2020.
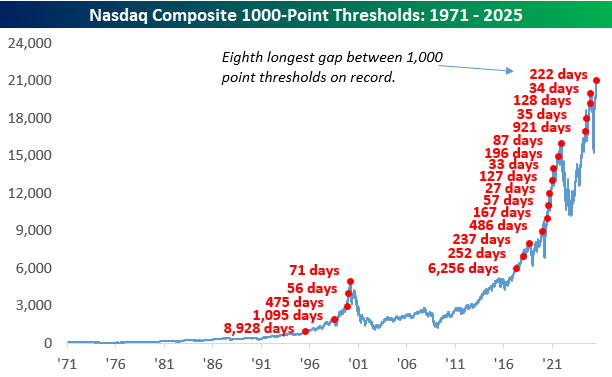
The long-term chart of the Nasdaq below shows when each 1,000-point threshold was first crossed along with the number of days between each one. After a period of 921 days without a new 1,000 point threshold, since the Nasdaq first closed above 17,000, it has crossed a new level four more times.
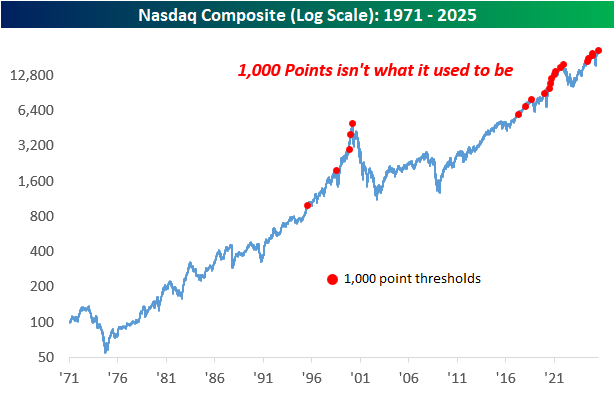
As mentioned above, 1,000 points isn’t what it used to be, and the Nasdaq’s price history on a log scale illustrates that as each 1,000-point level is more closely bunched together as the index rises over time. After requiring a rally of 100% to get from 1,000 to 2,000, it now takes a rally of less than 5% (and even less with each successive level reached) to reach a new 1,000 point threshold.

Jul 21, 2025
See what’s driving market performance around the world in today’s Morning Lineup. Bespoke’s Morning Lineup is the best way to start your trading day. Read it now by starting a two-week trial to Bespoke Premium. CLICK HERE to learn more and start your trial.
“Happiness in intelligent people is the rarest thing I know.” – Ernest Hemingway
Below is a snippet of commentary from today’s Morning Lineup. Start a two-week trial to Bespoke Premium to view the full report.
Stocks are poised to open the week higher this morning as we gear up for a busy week of earnings. The only economic indicator on the calendar this morning is Leading Indicators at 10 AM. In terms of earnings, we’ve already gotten reports from Cleveland Cliffs (CLF), Domino’s Pizza (DPZ), Roper (ROP), and Verizon (VZ). The only one of the four that missed EPS forecasts was DPZ, while it was the only one to miss estimates (barely) on the top line. After the close, the most notable reports on the calendar are Crown (CCK), NXP Semiconductors (NXPI), Steel Dynamics (STLD), and WR Berkley (WRB).
Outside of the US, Asian markets were mostly higher, while Japan was closed. Japan’s ruling party lost its majority in the weekend elections. While Asia was mostly higher, Europe is sitting on some modest losses in early trading with the STOXX 600 down 0.2%. Trade and tariffs continue to dominate the headlines there as the August 1st deadline approaches, and President Trump is pushing for 15% to 20% tariffs on all European imports.
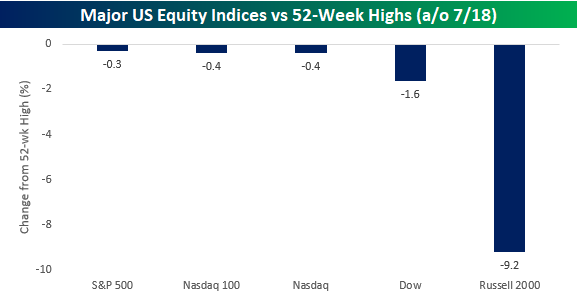
While the S&P 500, Nasdaq 100, and Nasdaq Composite all closed out the week within 1% of 52-week highs last Friday, the Dow Jones Industrial Average remains a little further off at 1.6%. The small-cap Russell 2000 remains in a league of its own, near correction territory at 9.2% below its 52-week high. Not all US equity indices are created equal.
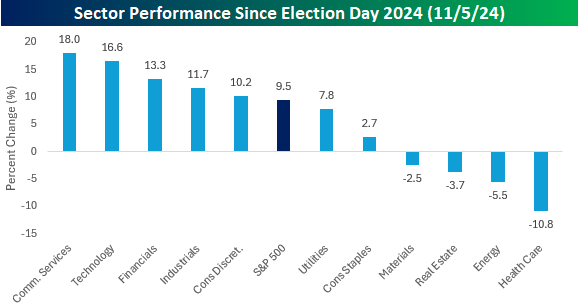
At the sector level, the haves vs have-nots is even more pronounced. Last Friday, just three sectors – Utilities, Technology, and Industrials – closed within 1% of their respective 52-week highs. After these three, Financials, Communication Services, and Consumer Staples closed out the week between 1% and 5% below their respective 52-week highs.
Nearly half of the S&P 500 sectors, however, remain more than 5% from their respective highs, including Energy (-11.7%) and Health Care (-16.3%), which are still deep in correction territory. While the Energy sector’s weight of 2.97% in the overall index is nearly inconsequential, the Health Care sector still has a respectable weighting of right around 9%.
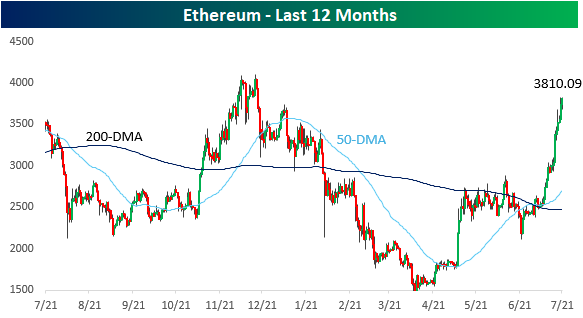
Outside of equities, the crypto space has been strong, and here, there’s been a relative rotation where the formerly overlooked Ethereum has been surging. After trading at $1,500 in April and below $2,500 as recently as July 4th, Ethereum is back up above $3,800 for the first time this year.
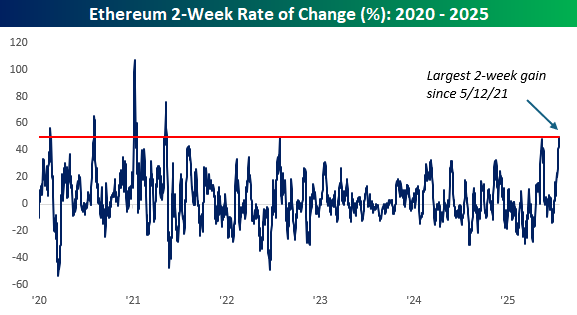
Based on where it’s trading this morning, Ethereum has rallied just over 50% in the last two weeks, which would put it on pace for the largest 14-day gain (crypto doesn’t take weekends off) in more than four years.
Jul 18, 2025
See what’s driving market performance around the world in today’s Morning Lineup. Bespoke’s Morning Lineup is the best way to start your trading day. Read it now by starting a two-week trial to Bespoke Premium. CLICK HERE to learn more and start your trial.
“Life is a helluva lot more fun if you say yes rather than no” – Richard Branson
Below is a snippet of commentary from today’s Morning Lineup. Start a two-week trial to Bespoke Premium to view the full report.
There’s little action going on in equity futures this morning as the market looks to close out what was an important week in terms of economic and earnings-related data on a positive note. Heading into the final session of the week, the Nasdaq is up 1.5% week to date while the S&P 500 is up a more modest, but still respectable 0.60%.
There are only a handful of earnings reports this morning, but some of the more notable ones were 3M (MMM), American Express (AXP), Charles Schwab (SCHW), and SLB. All four companies managed to top expectations on both the top and bottom line, continuing what has been a positive start to the Q2 earnings season. On the economic calendar, we’ll close the week with Housing Starts and Building Permits at 8:30, followed by Michigan Confidence at 10.
As mentioned, it was a significant week for economic data, particularly in terms of inflation, and the results came in just about as good as anyone could have hoped for. Of the nine different major metrics for the week, the only one that came in higher than expected was headline CPI on a y/y basis.
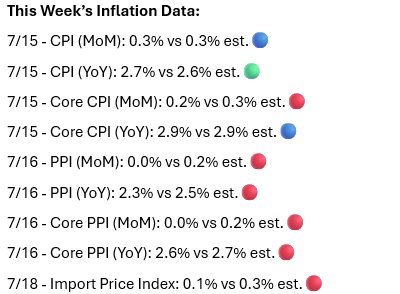
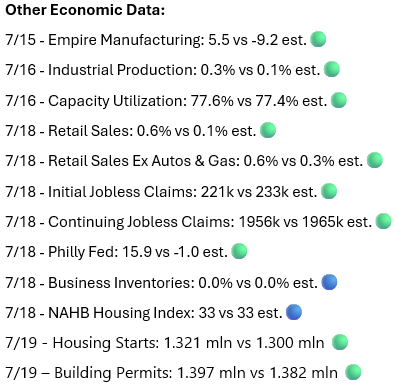
While most of the inflation-related data came in lower than expected, other data for the week were nearly across the board better than expected. Not a single report missed expectations, and the only reports that didn’t top expectations were Business Inventories and Homebuilder Sentiment.
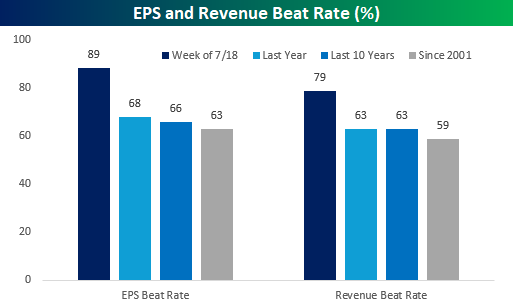
We’re only a week into earnings season, but the reporting period has gotten off to a strong start. 89% of the more than 75 companies that reported earnings this week topped EPS forecasts, and 79% exceeded sales estimates. Relative to the average EPS and sales beat rates over the last one and ten years, as well as going back to 2001, the readings for this earnings season are significantly better than expected.
Jul 15, 2025
See what’s driving market performance around the world in today’s Morning Lineup. Bespoke’s Morning Lineup is the best way to start your trading day. Read it now by starting a two-week trial to Bespoke Premium. CLICK HERE to learn more and start your trial.
“The first step towards getting somewhere is to decide that you are not going to stay where you are.” – J.P. Morgan
Below is a snippet of commentary from today’s Morning Lineup. Start a two-week trial to Bespoke Premium to view the full report.
To view yesterday’s CNBC segment on “The Exchange” where we discussed sentiment leading up to the Q2 earnings season, please click on the image below.
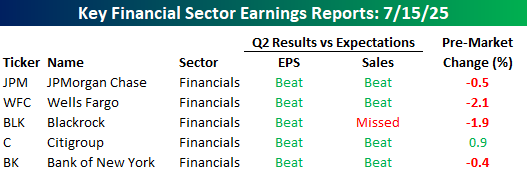
It’s taken long enough, but the Q2 earnings season is finally here, with several large banks, including J.P. Morgan Chase (JPM), reporting this morning. Of the reports we’ve seen so far, the results have generally been good, with five companies beating EPS forecasts and four topping consensus forecasts for sales. In response to the positive reports, though, four of the five stocks are trading lower. The magnitude of the declines has been very modest, and it’s still early, but the negative reactions could be a signal that investors have high expectations heading into earnings season.
While investors are taking a sell-the-news reaction to this morning’s results, futures for the S&P 500 and Nasdaq are both higher heading into this morning’s CPI report. The positive tone in futures stems from an announcement from Nvidia (NVDA) that it would resume sales of its H20 chips in China. In Europe this morning, markets are little changed, with the STOXX 600 up 0.2% while equities were mostly higher in Asia overnight.
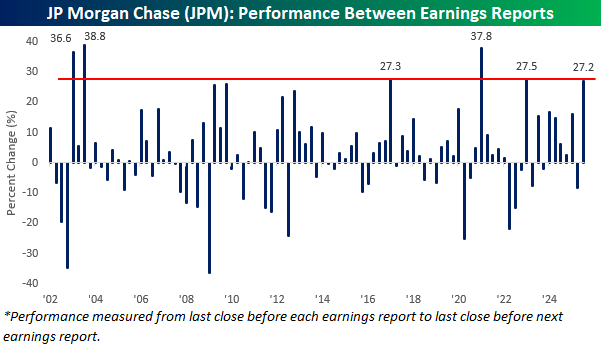
In yesterday’s CNBC segment, we discussed how the expectations bar is higher heading into this earnings season than it was last earnings season. To illustrate, let’s look at JP Morgan Chase (JPM). The chart below shows JPM’s performance from the close before one earnings report to the close before the next. Heading into today’s report, JPM had rallied 27.2% since the close before its last earnings report, and that ranks as the sixth-best performance between earnings reports since at least 2002 and the best since the three months leading up to its January 2023 earnings report. During Covid, JPM rallied 37.8%, and there were two quarters following the dot-com bust when the stock also rallied by more than 35%.
Just because JPM has rallied a lot leading up to this quarter’s report doesn’t mean it has to decline in the three months following its next earnings report. That being said, the stock’s median performance following periods when it had big gains leading up to one earnings report is lower than its performance following all other earnings reports. Of the nine prior periods when the stock rallied more than 20% in the three months between earnings reports, JPM’s median performance between its next two earnings reports was a decline of 1.0% with positive returns 44% of the time. For all other periods when the stock was up less than 20% since its last earnings report, the median performance between its next two reports was a gain of 3.4% with positive returns 65% of the time.
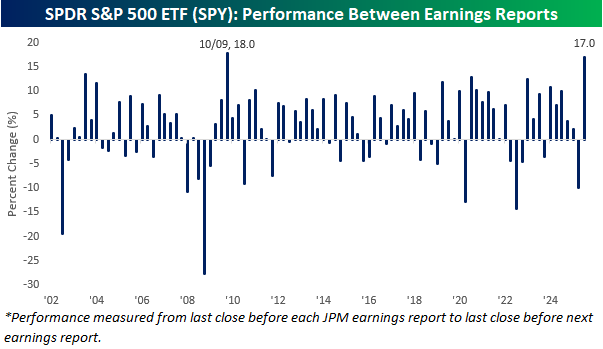
Since JPM typically reports very early on in earnings season, the chart below shows the performance of the SPDR S&P 500 ETF (SPY) between JPM reports since 2002. While the last three months have been the sixth-best period between earnings reports for JPM, in the case of SPY, its 17.0% has been the second-best. The only period between JPM reports that SPY performed better was leading up to its October 2009 report, when it rallied 18.0%. Based solely on the performance of SPY between JPM reports, the bar is higher heading into this current earnings season (with SPY up 17% over the last three months) compared to the 9.9% decline in the three months leading up to last April’s report. That decline was the sixth worst since at least 2002.