Aug 4, 2025
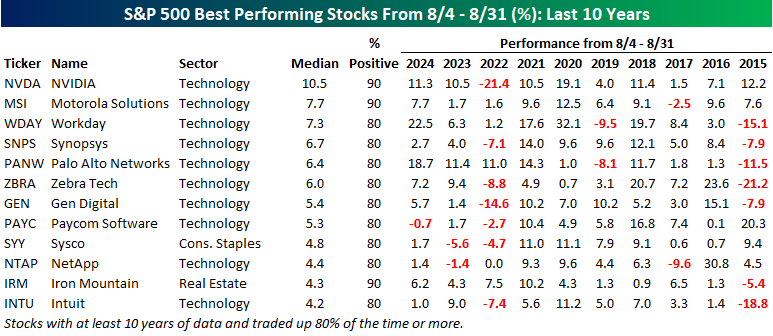
By now, you probably know that the market is currently in the early stages of what historically has been the weakest three-month period of the year for the S&P 500. Even in the weakest of periods, though, not every stock usually goes down. In what has historically been a weak period of time for the S&P 500, we screened our Seasonality Database for S&P 500 stocks that have historically performed the best from the close on 8/4 through the end of August.
The table below lists the dozen S&P 500 stocks that have experienced a median gain of at least 4% and traded higher at least 80% of the time from the close on 8/4 through 8/31. Topping the list, NVIDIA’s (NVDA) gain during this period has been 10.5% with gains 90% of the time. NVDA has become the face of AI since Chat GPT’s 2022 launch, but from 2015 through 2021, it also traded higher during this period each year. Along with NVDA, the only other stocks in the table that traded higher 90% of the time were Motorola Solutions (MSI) and Iron Mountain (IRM). What also stands out about the names on the table is that all but two of them are from the Technology sector.
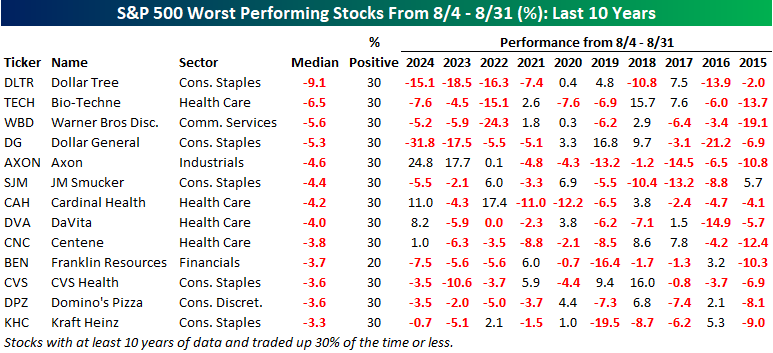
On the downside, the table below lists the thirteen stocks in the S&P 500 that have had a median decline of at least 3% from the 8/4 close through month-end, with gains 30% of the time or less. Topping the list of losers is Dollar Tree (DLTR) with a median decline of 9.1% and gains just 30% of the time. This has been an especially weak time of year for the stock over the last four years, as it has declined at least 7.4% each time. Axon (AXON) is another notable name on the list. Even with a median decline of 4.6%, it has been up during this period for three straight years with gains of 0.1%, 17.7%, and 24.8%, respectively. Unlike the list of winners, which was almost entirely Technology stocks, the list of losers is much more diverse, with six sectors represented, even as five are in the Consumer Staples sector.
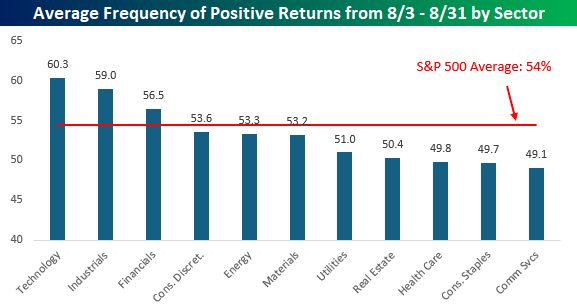
Just about all of the stocks listed on the table of best performing stocks from the close on 8/4 through month-end are from the Technology sector, and the chart below further illustrates the strength of the sector during this period. As shown, Tech-sector stocks have traded higher an average of 60.3% of the time from 8/4 through 8/31. Not far behind, stocks in the Industrials sector have traded higher an average of 59% of the time, followed by Financials with gains 56.5% of the time. These three sectors are also the only ones that have had a higher winning percentage than the S&P 500. To the downside, the only three sectors that have traded higher during this period less than half of the time are Communication Services, Consumer Staples, and Health Care.

Aug 4, 2025
See what’s driving market performance around the world in today’s Morning Lineup. Bespoke’s Morning Lineup is the best way to start your trading day. Read it now by starting a two-week trial to Bespoke Premium. CLICK HERE to learn more and start your trial.
“If you have to ask what jazz is, you’ll never know.” – Louis Armstrong

Below is a snippet of commentary from today’s Morning Lineup. Start a two-week trial to Bespoke Premium to view the full report.
The hangover for bulls came before the weekend last week, and they’re looking to start the week in a party mood with futures on all three major averages in the green and indicated to open about 0.5% higher. That’s only enough to erase a third of Friday’s losses, but it’s better than the alternative. Overnight in Asia, stocks were also firmly higher, while Europe’s STOXX 600 is up 0.6%. There’s no real catalyst for the gains this morning, but there’s also little in the way of economic and earnings data, so there’s not a lot of conviction behind the move.
While equities are moving higher, energy prices are down across the board, with WTI crude oil trading down 2% following the OPEC+ announcement that it would proceed with its September output hike of 547K barrels. Metals are fractionally higher across the board, and treasury yields are unchanged to modestly higher. Given the bounce in equities, you would expect to see crypto also rebound; however, both Bitcoin and Ether are still trading right around where they were last Friday.
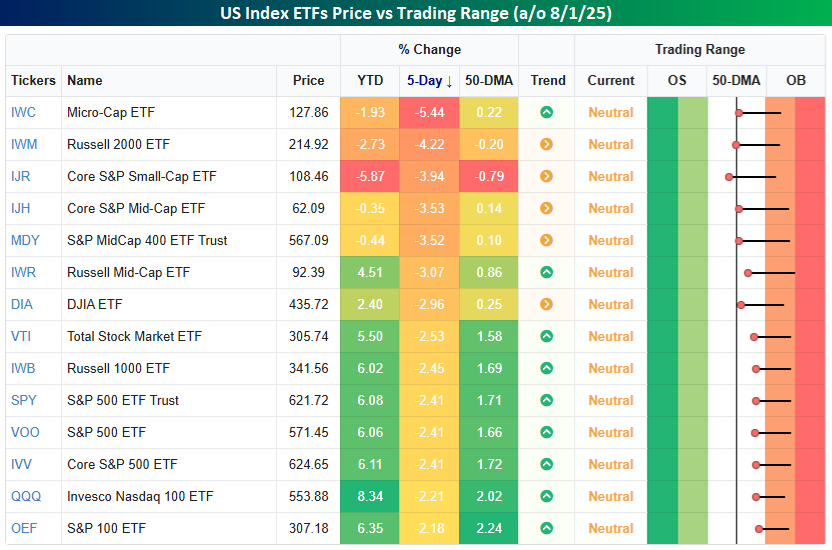
Right on cue, it seems, the typical late summer seasonal weakness has interrupted a market that had a consistent early summer bid. After a string of record highs, the S&P 500 sold off on an intraday basis every day last week. When the bell rang on Friday, the Nasdaq 100 (QQQ) and S&P 500 (SPY) were both down over 2% for the week, while the ne’er-do-well Russell 2000 (IWM) fell over 4%. As steep as the declines were, though, only two of the fourteen index ETFs shown below finished the week below their 50-day moving averages (DMA), and all fourteen were in neutral territory.
Aug 1, 2025
To read our weekly Bespoke Report newsletter and access everything else Bespoke’s research platform offers, start a two-week trial to Bespoke Premium. In this week’s report, we cover the market running out of steam after a relentless rally, a lackluster response to earnings season, and much more.

Aug 1, 2025
See what’s driving market performance around the world in today’s Morning Lineup. Bespoke’s Morning Lineup is the best way to start your trading day. Read it now by starting a two-week trial to Bespoke Premium. CLICK HERE to learn more and start your trial.
“Simple can be harder than complex”– Steve Jobs
Below is a snippet of commentary from today’s Morning Lineup. Start a two-week trial to Bespoke Premium to view the full report.
We almost made it through the week unscathed. The mega-caps reported generally good results, economic data didn’t ruffle any feathers, and Fed Chair Powell held to form and was a downer for stocks, but not by a lot. The only other hurdle was the August 1st tariff deadline, and for a President who thrives on volatility, his actions last night certainly shook things up. In a series of actions, Trump issued new tariff duties ranging from 10% to 41%. We cover this in more detail in the commentary of today’s Morning Lineup, and the actual impact will not be as painful as the headline numbers suggest. For a market that was already starting to act heavy, though, the tariff news pushed futures lower.
Along with weakness in US equities, Asian and European stocks fared even worse, bond yields moved slightly higher, oil prices declined, gold was little changed, platinum and palladium are both down close to 2%, and crypto prices are down sharply with declines of 1.5% in Bitcoin and over 3% in Ethereum.
We’re through most of the earnings data for the week, but on the economic calendar, we still have the July Employment report, ISM Manufacturing, Construction Spending, and Michigan Sentiment. Already this morning, the President has been railing against Powell, and if any of this morning’s data comes in weaker than expected, expect the volume on his Truth Social account to get to eleven quickly.
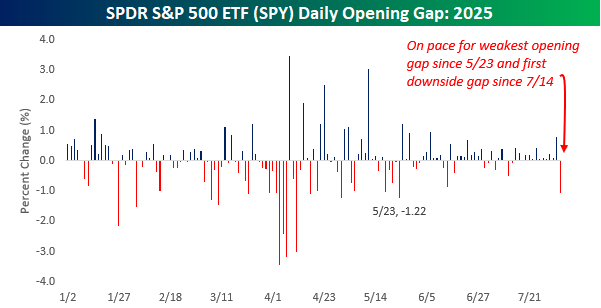
Hold on to your hats for a second, because the S&P 500 is on pace to not only open lower this morning, but at current levels, the decline would be about 1%. As shown in the chart below, the last time the SPDR S&P 500 ETF (SPY) gapped down 1%+ at the open was in late May, and it hasn’t opened lower since July 14th.
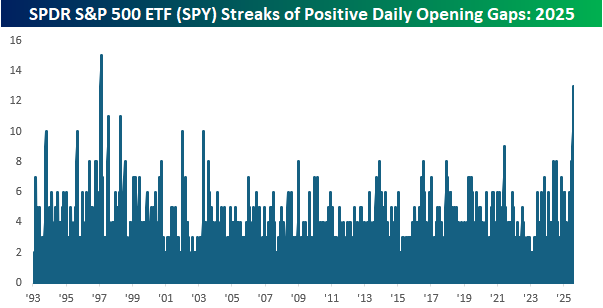
With 13 straight days of gains at the open, the streak that is about to end would be the second-longest in SPY’s history. The only streak that was longer ended in February 1997, and there were only two other streaks that lasted longer than ten days – July 1997 and February 1998. The comparisons always seem to go back to the late 1990s, don’t they?
Jul 31, 2025
Our Matrix of Economic Indicators provides a concise summary analysis of the US economy’s momentum. We combine trends across the dozens and dozens of economic indicators in various categories like manufacturing, employment, housing, the consumer, and inflation to provide a directional overview of the economy.
To access our newest Matrix of Economic Indicators, start a two-week free trial to either Bespoke Premium or Bespoke Institutional now!