Mar 16, 2026
See what’s driving market performance around the world in today’s Morning Lineup. Bespoke’s Morning Lineup is the best way to start your trading day. Read it now by starting a two-week trial to Bespoke Premium. CLICK HERE to learn more and start your trial.
“Philosophy is common sense with big words.” – James Madison

Below is a snippet of commentary from today’s Morning Lineup. Start a two-week trial to Bespoke Premium to view the full report.
It’s been a tough few weeks for equities. After months of trading in a sideways range, the war in Iran has put an added weight on the bearish side of the scale, pushing stocks lower. All of the major US indices are below their 50-DMAs, and the 200-DMAs are now starting to come into play as well. The short-term key has been and will continue to be oil prices. With no spike this morning, equities are taking the opportunity to rally, and we’ve been picking up steam as the morning drags on. The S&P 500 is on pace to gap up 0.75% as the open, while the Nasdaq is up closer to 1%. Now, let’s see if the gains can hold!
Outside of equities, treasury yields are falling with the 10-year yield down 5 bps to 4.24%, and crude oil falls almost 2% to just under $97 per barrel. Gold prices are down just over 1% and barely hanging on to $5,000, while bitcoin is up nearly 3% and above $73K.
Asian stocks were flat to higher to start the week on the optimism that oil prices didn’t spike more after the weekend. Japanese stocks traded down 0.1% while China was down 0.8%. Hong Kong, India, and South Korea, however, all rallied more than 1%. The declines in China came despite better-than-expected February data for Industrial Production, Retail Sales, and Fixed Investment.
European stocks have taken a more muted start to the week. The STOXX 600 is down 0.1% while Germany is up 0.3% and Italy drops 0.3%. It will be a busy week for central banks on the continent as the ECB, BoE, and SNB all have meetings.
It’s a relatively busy day for economic data this morning, with the Empire Manufacturing report for March hitting the tape at 8:30, followed by Industrial Production and Capacity Utilization at 9:15. Homebuilder sentiment will come out at 10 AM. Another area of focus today will be on Nvidia (NVDA) as CEO Jensen Huang will give the keynote speech at his company’s GTC conference at 2 PM Eastern. Looking ahead, the Fed will announce its latest policy decision on Wednesday.
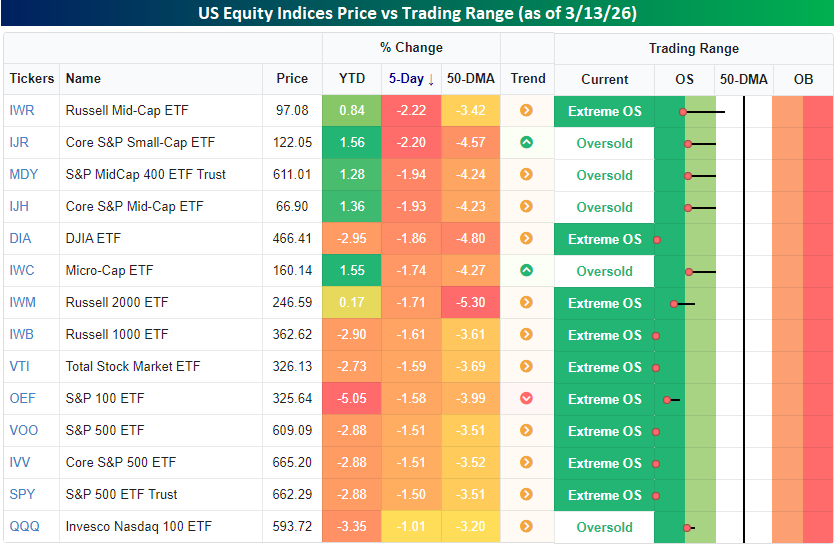
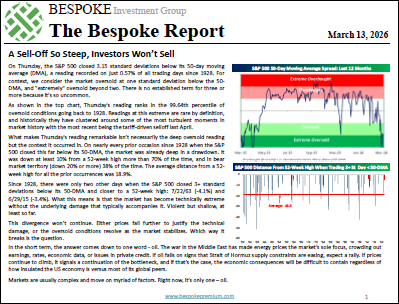
The S&P 500 has declined for four straight weeks now, but still hasn’t even declined 5% from its closing high in late January, so while it’s been a slump, it could be worse. Even with the relatively modest declines, as we discussed in Friday’s Bespoke Report, it still finds itself in what we consider ‘extreme’ oversold levels as it closed more than two standard deviations below its 50-DMA. Along with the S&P 500, the majority of other US index ETFs also finished off last week in extreme oversold territory, and the ones that aren’t are still in oversold territory.
Last week, there was a little bit of rotation in the market where the indices that had been performing the best YTD (small and mid-caps) experienced the largest declines, while large caps, which had been the weakest, were down less. It’s all relative, though, as even the best-performing US indices last week were still down over 1%.
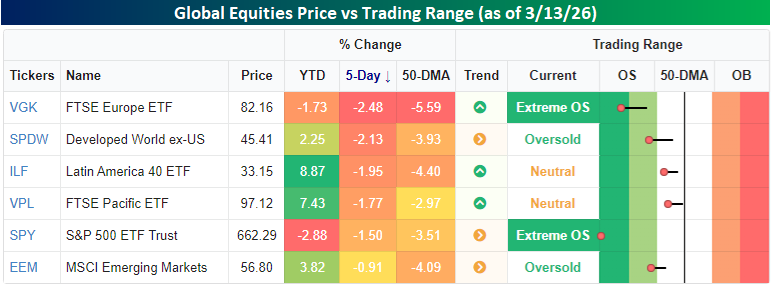
Similar to the relative outperformance of large caps versus small caps last week, US stocks outperformed their global peers once again last week, further digging out of their relative hole on a YTD basis. While the S&P 500 was down 1.5%, European stocks traded down by 2.5% last week, putting them into ‘extreme’ oversold territory with the US. The only areas of the world not oversold heading into the new week are Latin America (ILF) and Asia Pacific (VPL).
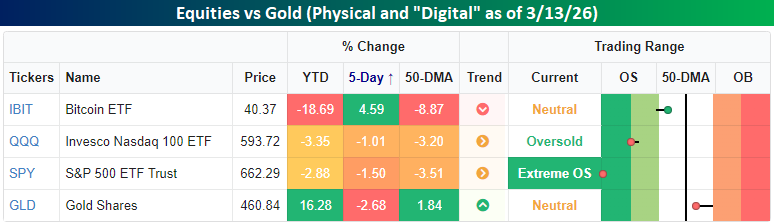
With equities under pressure, investors must be taking shelter in the safety of gold, right? Not really. Physical gold hit a speed bump last week, falling more than 2.5%. Despite the decline, though, it’s still up over 16% YTD and above its 50-DMA, so don’t shed too many tears for the gold bugs. One area of surprising strength last week was in Bitcoin (IBIT). While it’s still down close to 20% this year, it managed to rally more than 4.5% last week. As they say, even a broken clock is right twice a day.
Mar 13, 2026
To read our weekly Bespoke Report newsletter and access everything else Bespoke’s research platform offers, start a two-week trial to Bespoke Premium. It was another eventful week in the market as we witnessed an extraordinary divergence between the S&P 500’s extreme oversold reading despite its relatively close proximity to all-time highs. This divergence won’t continue. Either prices fall further to justify the technical damage, or the oversold conditions resolve as the market stabilizes. Which way it breaks is the question. In this week’s Bespoke Report, we discuss the main factor(s) facing the market and put some of the recent moves into perspective.

Mar 13, 2026
See what’s driving market performance around the world in today’s Morning Lineup. Bespoke’s Morning Lineup is the best way to start your trading day. Read it now by starting a two-week trial to Bespoke Premium. CLICK HERE to learn more and start your trial.
“Don’t let what you cannot do interfere with what you can do.” – John R. Wooden
Below is a snippet of commentary from today’s Morning Lineup. Start a two-week trial to Bespoke Premium to view the full report.
The market has one more day to salvage what’s been a negative week for stocks, and so far, it’s making a valiant effort. Futures on the S&P 500, Nasdaq, and Dow are all up 0.39%. With today being both Friday the 13th and the last day of trading into a weekend, it’s surprising to see equities catching a bid. Treasury yields are modestly lower, with the 10-year yield at 4.25%, and oil prices are down 2% to $93.50 per barrel. Gold prices are also pulling back, but Bitcoin is trading up close to 3% and above $72K.
Asian stocks ended what was already a down week on a negative note. The Nikkei was down over 1%, which took its weekly decline to over 3%, while China finished the week with a 0.7% decline, and India was down over 5%. Higher oil prices are a major pain point for the Asian economy, so the longer the Strait of Hormuz remains cut off, the more pressure it will put on these economies.
Equity performance has been more muted in Europe. The STOXX 600 is little changed for both the day and week, and no major index in the region is up or down more than 0.5% on the day. Industrial Production for January fell 1.5% versus expectations for an increase of 0.6%. Weaker growth, coupled with increasing inflationary pressures from rising energy prices, is the type of cooking markets would prefer not to see on the menu.
The economic calendar is jam-packed this morning with most of the reports (Personal Income, Personal Spending, GDP, PCE, Durable Goods) hitting the tape as we send this out, but at 10 AM Eastern, we’ll also get Michigan Confidence and JOLTS.
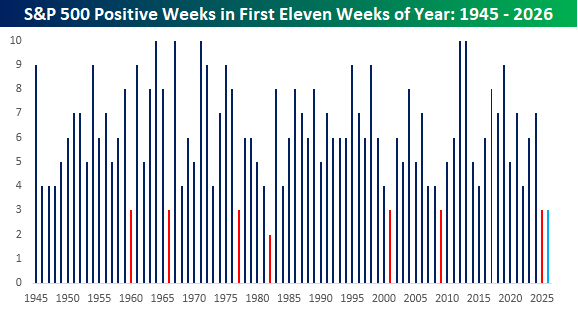
With the S&P 500 down 1% on the week heading into today, we’re on pace for the eighth negative week in the first eleven weeks of the year. With just three positive weeks, it’s been one of the weakest starts to a year for the S&P 500 in the post-WWII period. If the S&P 500 doesn’t rally more than 1% today, it will be the eighth year since 1945 that it has had three or less positive weeks to start a year. Ironically, last year also started weak, and while the market remained shaky through early April, it ended up being a good year. Before last year, the last time the year started out this inconsistently was in 2009, and the only year where there were fewer positive weeks to start a year was in 1982.
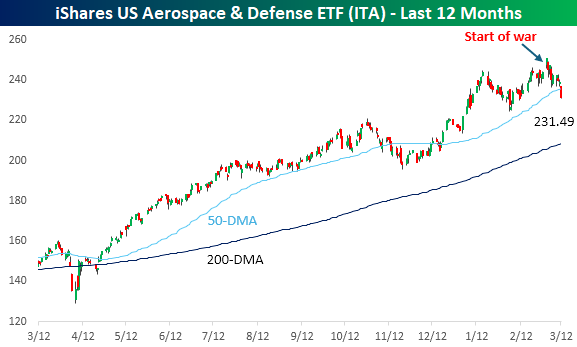
Two groups you would expect to benefit from the war in the Middle East are energy and defense stocks. Right out of the playbook, Energy stocks have rallied since the war broke out, but defense stocks have taken a sell-the-news response.
The chart below shows the performance of the iShares US Aerospace and Defense ETF (ITA) over the last year. While the ETF has surged over the last 12 months, it has struggled since the first missiles were fired. While ITA gapped up the Monday after markets reopened for trading after the war started, it’s been drifting lower ever since. Yesterday, it closed below its 50-DMA for the first time this year, and as Bloomberg noted in a news story overnight, the ETF had the largest outflow of assets in its history yesterday. Understandably, investors would take profits after the rally of the last year, but it’s interesting to see it follow the opposite path of Energy stocks.
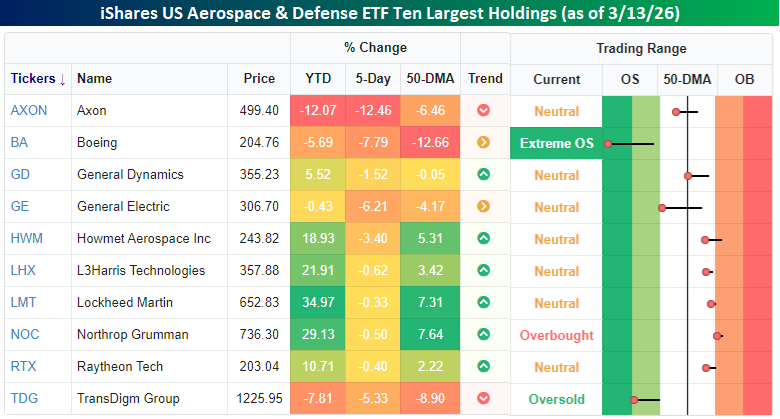
Below, we show the ten largest holdings in the ITA ETF and where each one closed relative to its trading range yesterday. Over the last week, all ten stocks are lower and some by a lot. General Electric (GE) and Boeing (BA) are the ETF’s two largest holdings, and both stocks are down more than 6% in the last week alone. For BA, that decline has taken it more than 12% below its 50-DMA and into ‘extreme’ oversold territory (2+ standard deviations below 50-DMA).
Mar 12, 2026
See what’s driving market performance around the world in today’s Morning Lineup. Bespoke’s Morning Lineup is the best way to start your trading day. Read it now by starting a two-week trial to Bespoke Premium. CLICK HERE to learn more and start your trial.
“Great things are not accomplished by those who yield to trends and fads and popular opinion.” – Jack Kerouac
Below is a snippet of commentary from today’s Morning Lineup. Start a two-week trial to Bespoke Premium to view the full report.
Paul Hickey appeared on CNBC’s Money Movers yesterday to discuss the moves in the energy market and their impact on the equity market. To view the segment, click on the image below.
After a mixed session yesterday where the Nasdaq finished up 8 basis points (bps) while the S&P 500 fell 8 bps, US futures are firmly lower this morning, with the S&P 500 and Nasdaq both indicated to open down by about 35 bps. The primary culprit is crude oil, where prices are up over 5% and back above $90 as Iran stepped up attacks on tankers in the Persian Gulf. Energy Secretary Chris Wright was also just on CNBC and noted that the US is not yet ready to escort tankers through the Strait of Hormuz, but could be mobilized later this month. As long as the bottlenecks around the Strait continue, oil prices will remain elevated, raising the risk that the conflict makes its mark on the economy.
With crude oil prices rising, treasury yields are higher again as investors focus on the potential inflationary impacts. Gold prices are essentially flat, silver is up 2%, and Bitcoin is down fractionally but still above $70K.
Stocks were down across the board in Asia overnight, as the Nikkei was down 1.0%, while China’s Shanghai Composite was only down 0.1%, and the Kospi fell 0.5%. Relative to the last two weeks, it was a muted session! Given the spike in crude oil prices and the region’s dependence on energy imports, you could make the argument that it could have been worse.
In Europe, equities are also taking the overnight spike in crude oil prices in stride. The STOXX 600 is down just 0.4%, while Germany is fractionally higher. We’re also starting to see impacts of the conflict showing up in corporate results as UK travel firm On the Beach lowered guidance, citing a sharp slowdown in travel bookings for locations in the Eastern Mediterranean.
On the economic calendar this morning, we just had jobless claims, Building Permits, and Housing Starts at 8:30. Initial claims came in 2K lower than expected, while continuing claims were 1K higher, so from this perspective at least, the labor market remains very well behaved. With respect to the housing numbers, permits were lower than expected (1376K vs 1410K) while starts were much higher than expected (1487K vs 1341K), although much of the strength was due to multi-family units.
With treasury yields moving higher, it’s been a rough month for homebuilder stocks. The SPDR S&P Homebuilder ETF closed at $121.36 on 2/13, but has since declined more than 15% through yesterday’s close. Those highs in February were enough to push the group to 52-week highs, but the gains for 2026 quickly evaporated, and it’s now close to testing support at the $100 level.
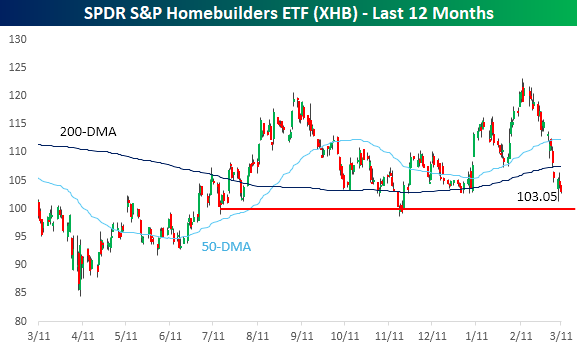
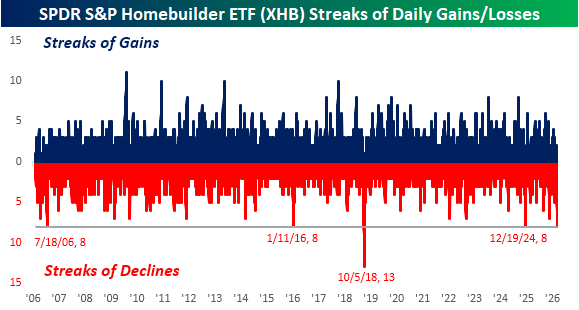
Part of that 15% decline since the February highs includes what is now an eight-day losing streak, which is tied for the longest losing streak in the ETF’s entire history. The last time there was a streak this long was over a year ago in late 2024, and the only longer streak was 13 days ending in October 2018.
Mar 11, 2026
See what’s driving market performance around the world in today’s Morning Lineup. Bespoke’s Morning Lineup is the best way to start your trading day. Read it now by starting a two-week trial to Bespoke Premium. CLICK HERE to learn more and start your trial.
“I attack ideas. I don’t attack people. Some very good people have some very bad ideas.” – Antonin Scalia
Below is a snippet of commentary from today’s Morning Lineup. Start a two-week trial to Bespoke Premium to view the full report.
Paul Hickey will be on CNBC at 11 AM Eastern to discuss markets and today’s CPI.
Futures were in a holding pattern ahead of today’s CPI, with the S&P 500 and Nasdaq both indicated to open down about 0.1% despite Oracle (ORCL) trading up over 10% in reaction to earnings. Treasury yields moved higher ahead of the report, with the 10-year yielding 4.17%, and crude oil was up over 4% to $87 per barrel. Gold and Bitcoin prices are down about 1%.
For Asian equities, the last several days have been something of an all-or-nothing trade where the major averages in the region are either all sharply higher or lower. Last night, there was more dispersion. While Japan and South Korea were both up 1.4%, Hong Kong was fractionally lower, and India declined 1.7%. In South Korea, exports for the first 10 days of March were up 55.6% y/y, with chip exports surging more than 175%. In Japan, PPI fell 0.1% versus expectations for an increase of 0.1%.
In Europe, the move was more uniform, and unfortunately for bulls, it was mostly lower. The STOXX 600 is down nearly 0.5%, with Germany leading the losses with a decline of nearly 1% as German CPI for February rose 0.2%, which was right in line with forecasts.
In the US, the only economic report on the calendar today is February CPI, which given the events of the last two weeks, has become much less pertinent to the market. While it may not be a major focus of the market this morning, CPI was right in line with expectations as headline increased 0.3% m/m and core increased 0.2%
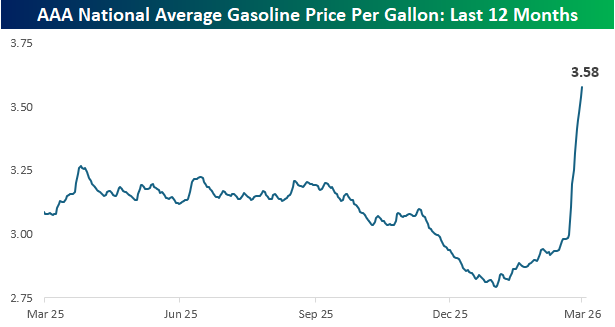
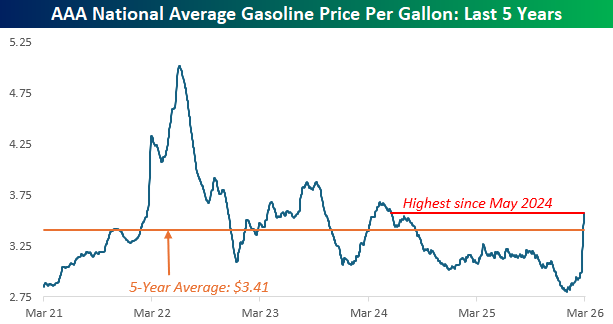
Through yesterday’s close, average prices at the pump have now surged to $3.58 per gallon, which represents a 20% increase this month alone. In the span of two months, prices have spiked from a 52-week and multi-year low to a 52-week high, easily surpassing the prior peak from last spring.
As shocking as the one-year chart looks, taking a longer-term look at crude oil prices shows a less dire picture. Current gasoline prices are now at the highest level since May 2024, but they’re still nearly 30% below the 5-year peak from June 2022, and less than 5% above the 5-year average. That doesn’t make it any easier to stomach, but at least it provides some decent perspective.
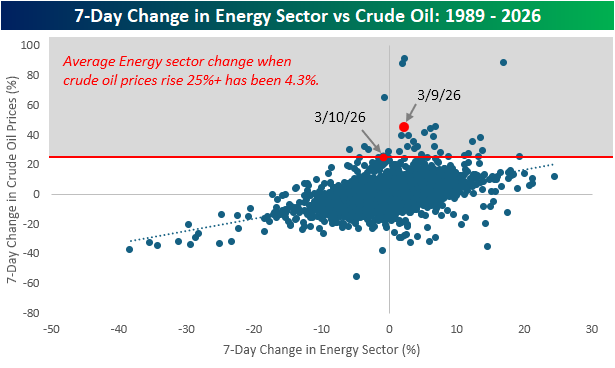
In the seven trading days since the war on Iran started, crude oil prices are up 25%, and as of yesterday, the seven -day change was over 45%. With such large increases, it seems like a disconnect that the S&P 500 Energy sector is up just 2%. The chart below compares the 7-day change in the S&P 500 Energy sector to the 7-day change in crude oil prices. While there has historically been a positive correlation between the two, in periods when crude oil prices have spiked 25% or more, the average change in the Energy sector has been a gain of 4.3%. The implication of those muted gains? The market views these price spikes as temporary.