Aug 13, 2025
See what’s driving market performance around the world in today’s Morning Lineup. Bespoke’s Morning Lineup is the best way to start your trading day. Read it now by starting a two-week trial to Bespoke Premium. CLICK HERE to learn more and start your trial.
“Ideas come from everything” – Alfred Hitchcock

Below is a snippet of commentary from today’s Morning Lineup. Start a two-week trial to Bespoke Premium to view the full report.
Following yesterday’s CPI, traders are looking to extend the rally this morning, as futures indicate a gain of approximately 0.25% at the open. This morning, in an interview on Bloomberg TV, Treasury Secretary Scott Bessent expressed a view that the Fed should cut rates by 50 bps in September. Additionally, for anyone concerned that the Administration might end the monthly release of Non-Farm Payrolls, Bessent stated that he would not support such a move.
There’s no economic data on the calendar, but we will hear from multiple Fed Presidents throughout the day. Overnight, Asian stocks rallied, led by the Hang Seng, which surged 2.6% while the Nikkei added another 1.3% on top of Tuesday’s gains. The gains came even as a 5-year JGB auction was met with little demand. The gains in Asia flowed into Europe this morning as well, as the STOXX 600 is up 0.4% as inflation data in Germany and Spain was in line with expectations.
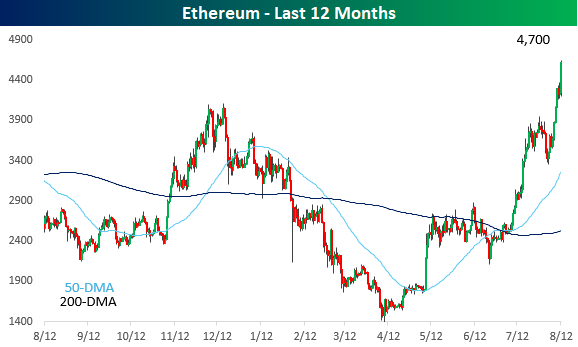
Known by most as either the ‘other crypto’ besides Bitcoin or the Bitcoin bridesmaid, Ethereum looks to be walking down the aisle on its own lately as the world’s second-largest cryptocurrency has surged from under $1,500 in April to $4,700 this morning. Over the last week, Ethereum’s price has broken out above the highs from Q4 of last year to new 52-week highs.
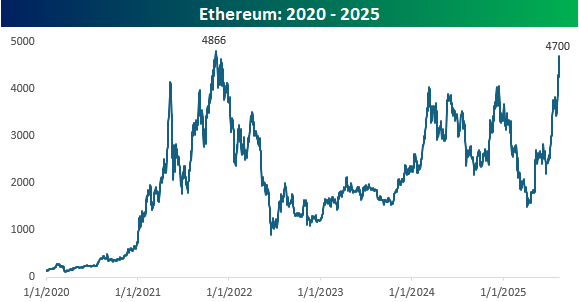
From a longer-term perspective, Ethereum is now not far from its all-time high of just under $4,900, and this morning, Standard Chartered raised its year-end price target to $7,500 and sees it trading as high as $25,000 by the end of 2028. That’s the beauty of dramatic price targets; they generate headlines when they’re made, but no one ever looks back to see if they actually panned out (hint: they seldom do).
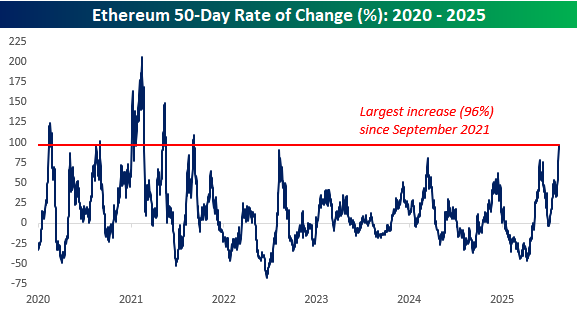
This latest surge in Ethereum has been extreme to say the least, with the 50-day rate of change rising to 96%. A move of that magnitude hasn’t been seen since September 2021.
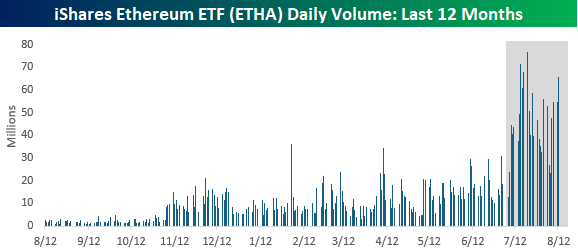
Along with the surge in price, volume in Ethereum has also surged. The chart below shows the daily volume in the iShares Ethereum ETF (ETHA) over the last year. From the start of 2025 through the end of Q2, average daily volume in ETHA was 12.3 million shares. Since the start of July, though, average daily volume has been more than 3.5 times that at just under 44 million shares per day.
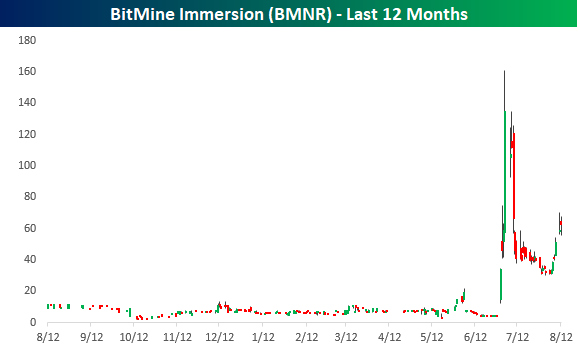
So, what’s behind the surge in Ethereum prices and volume over the last 6 or 7 weeks? As shown in the chart below, the move into overdrive coincided with the announcement at the end of June that BitMine Immersion (BMNR) would become an Ethereum treasury company, sending that stock from under $5 to as high as $161. While it pulled back quickly, at yesterday’s closing price of $62.44, the stock is still up 1,364% since June 27th!
Aug 12, 2025
This content is for members only
Aug 12, 2025
See what’s driving market performance around the world in today’s Morning Lineup. Bespoke’s Morning Lineup is the best way to start your trading day. Read it now by starting a two-week trial to Bespoke Premium. CLICK HERE to learn more and start your trial.
“Reading the record, it is striking how many calamities that I anticipated did not in fact materialise.” – George Soros
Below is a snippet of commentary from today’s Morning Lineup. Start a two-week trial to Bespoke Premium to view the full report.
After a quiet day yesterday, futures aren’t doing much this morning either as investors await the release of July CPI. European markets started the day higher but have been selling off throughout the day (sound familiar?), and Asia had a mixed session, although Japan rallied more than 2% after being closed for trading on Monday. While Japanese stocks traded higher, there was literally no trading in Japan’s 10-year JGBs. That was the first time that had happened since March 2023.
July CPI came in right in line with expectations as the headline reading increased 0.2% and core rose 0.3%. On a y/y basis, headline CPI was a tenth weaker than expected at 2.7% while the core reading was a tenth higher than expected (3.1%). The initial reaction to the move was slightly lower yields and higher stock prices.
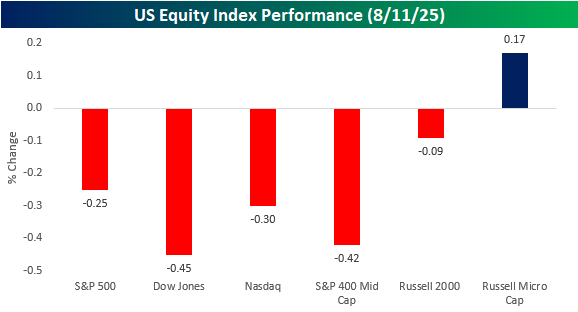
It’s hard to read too much into market activity on a quiet day in August, but the trend of intraday weakness continued to start the week as the S&P 500, as measured by SPY, closed lower than it opened for the tenth time in the last fifteen trading days. When the bell finally rang, the S&P 500 finished down 0.25%, the Dow was down 0.45%, while the Nasdaq fell 0.30%. Besides those major large-cap indices, mid-caps slumped 0.42% while small caps held up relatively well with a decline of 0.09%. The only small ray of sunshine yesterday was in the Russell Microcap Index, which finished the day 0.17% higher. When we say small, we mean it, though. The combined market cap of the companies in the index is just $426 billion, which is smaller than Netflix (NFLX), and the average market cap of companies in the index is under $400 million, with an M!
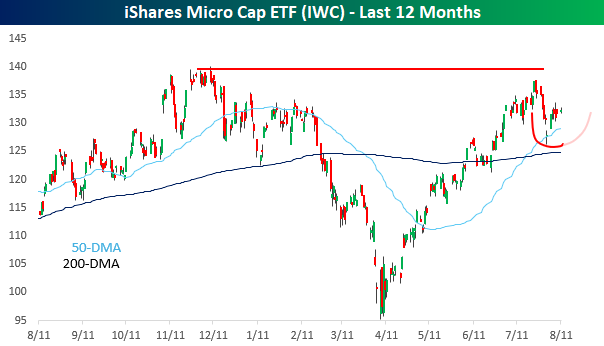
Looking at the performance of micro-caps, as measured by the iShares Microcap ETF (IWC), after testing the Q4 highs in late July, they pulled back to the 50-day moving average, where they bounced to kick off August. It’s still early, but if the bounce holds, the index could be rounding out the right side of a cup and handle formation.
Aug 11, 2025
The mega-cap stocks took the baton last week and drove the market higher. While the S&P 500 was up about 2.4%, the 492 stocks in the index with market caps of less than a trillion dollars were up an average of just 0.71%. Meanwhile, the eight $1+ trillion dollar stocks were up an average of 5.7%, led higher by stocks like Apple (AAPL) and Alphabet (GOOGL) with gains of more than 5%. Weren’t these two stocks that the street had written off for dead just a couple of weeks ago?
Collectively, the eight $1+ trillion stocks account for over 35% of the S&P 500. These are, and will continue to be, the main drivers of the market.
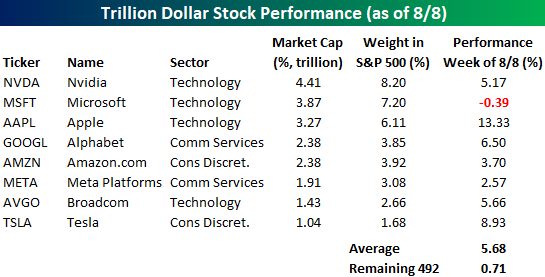
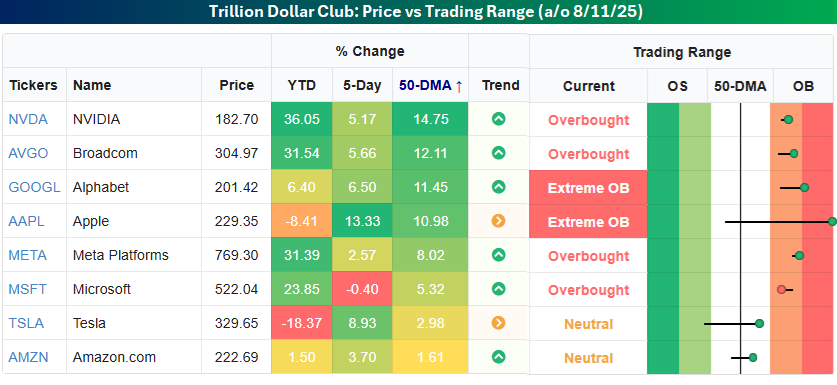
Some of the trillion dollar stocks have gotten quite extended, with Nvidia (NVDA), Broadcom (AVGO), Alphabet (GOOGL), and Apple (AAPL) now trading more than 10% above their 50-day moving averages.
In Thursday’s Morning Lineup, we noted the dispersion in YTD performance using the Dow Jones Industrial Average as an example. Within the trillion-dollar stocks, we’ve seen the same degree of divergence with more than 50 percentage points separating the group’s biggest YTD winner and loser.
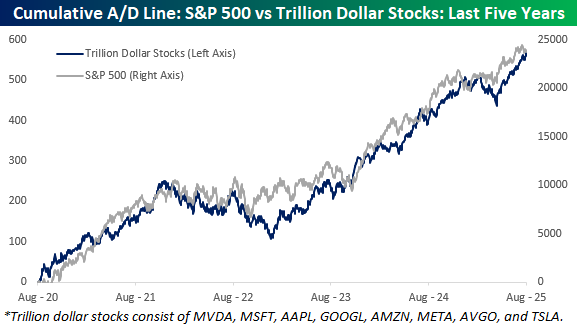
Since the trillion-dollar stocks will have such a large say in how the market moves from here, we wanted to check up on the group’s breadth compared to the S&P 500. The chart below compares the S&P 500’s cumulative A/D line to the cumulative A/D line of the trillion-dollar stocks over the last five years. For the most part, they have tracked each other very closely, and both remain near record highs, so there’s been no major divergence between the mega-caps compared to the rest of the market.
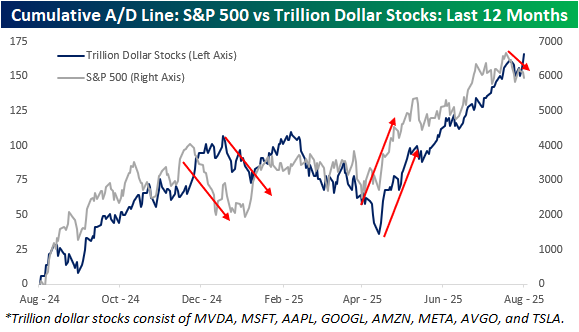
Zooming in on the last year shows similar patterns in both cumulative A/D lines, but with more granularity, you can also see some zigs in the S&P 500’s cumulative A/D line when the cumulative A/D line of the trillion-dollar stocks zags. Late last year, the S&P 500’s cumulative A/D line started to roll over about a month before the trillion-dollar stocks, and then in the Spring, the S&P 500’s A/D line bottomed a couple of weeks before the trillion-dollar stocks. That brings us to last week. As mentioned above, while the S&P 500 was up sharply last week, the majority of the gains were the result of the big moves higher in the trillion-dollar stocks. That divergence was also evident in the cumulative A/D lines as the S&P 500 finished the week well off its 7/25 high, while the one for the trillion-dollar stocks hit a new high. At this point, it’s just a modest divergence, but the last two divergences began modestly as well before turning into more extended moves.

Aug 8, 2025
See what’s driving market performance around the world in today’s Morning Lineup. Bespoke’s Morning Lineup is the best way to start your trading day. Read it now by starting a two-week trial to Bespoke Premium. CLICK HERE to learn more and start your trial.
“But the interest of the Nation must always come before any personal considerations.” – Richard Nixon
Below is a snippet of commentary from today’s Morning Lineup. Start a two-week trial to Bespoke Premium to view the full report.
On this day, 51 years ago, President Nixon became the first U.S. president to resign from office. While there are plenty of others that Americans likely wish had also resigned from office since then, Nixon remains the only President to leave office before his term ended, despite saying in his resignation speech that “I have never been a quitter.” As crazy as the political, social, economic, and geopolitical climate feels today, it has nothing on the backdrop from 51 years ago. If you weren’t around then, just ask someone who was.
There’s no shortage of uncertainty or unease in the backdrop today, but equities are within percentage points of record highs, and interest rates are relatively low versus history. This morning specifically, futures are firmly in positive territory on generally positive earnings news overnight. There’s no economic data on the calendar today, and all the earnings for the week are behind us, so unless the President fires up the Truth Social app, we can expect a relatively quiet summer Friday.
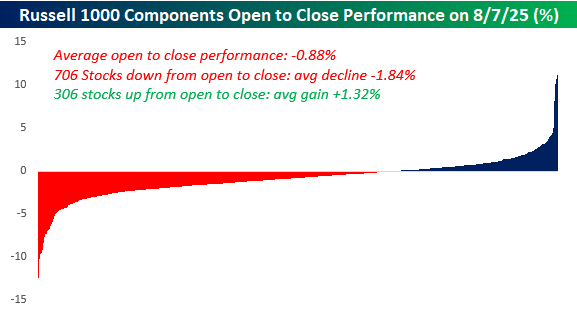
In yesterday’s trading, there were many quitters. Stocks opened the day higher and gave up their gains throughout the trading day. On an average basis, stocks in the Russell 1000 declined 0.88% from the open to close. Of the index’s components, 706 closed lower than they opened, and their average decline from the open to closing bell was 1.84%. On the upside, only 306 stocks (there are more than 1,000 stocks in the index) closed higher than they opened, and their average gain was just 1.32%.
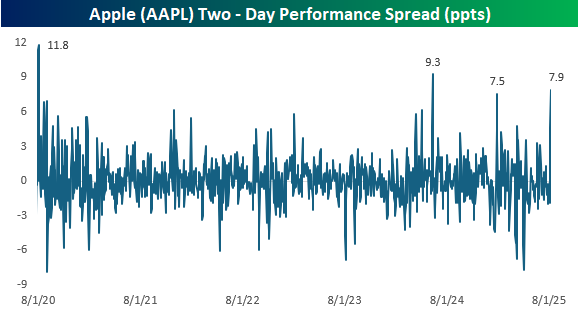
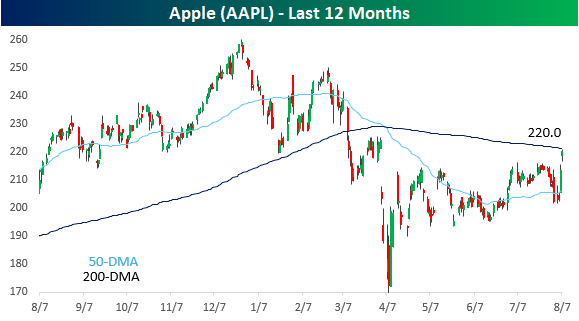
One stock that didn’t quit yesterday was Apple (AAPL). It gapped up around 2% and then added on another 1% from the open to close to finish just below its 200-day moving average (DMA), a level it hasn’t traded above since early March. While the stock didn’t quit Thursday, downward-sloping moving averages have a way of acting as resistance, so whether AAPL can close above its 200-DMA to close out the week will say a lot about how strong this latest two-day rally is. Will today be the day that Cook & Co can say to the bears that they won’t have Apple to kick around anymore?
Besides rallying over 8% in the last two days, AAPL also outperformed the S&P 500 by just under 8% since Tuesday’s close, which ranks as one of the strongest two-day rallies relative to the S&P 500 in the last five years. The only two that were stronger were an 11.8 ppt performance spread in early August 2020 after the company reported earnings, and then a 9.3 ppt margin of outperformance after the company’s WWDC conference last summer. Besides those two periods, the only other two-day period of outperformance that was close to the last two days was a 7.5 ppt performance spread following its January report.