Aug 21, 2025
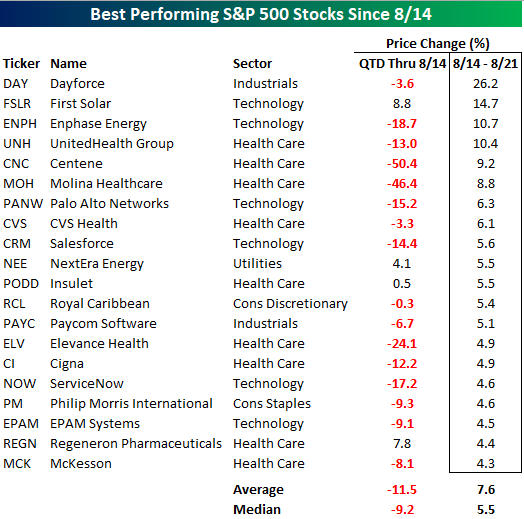
With the S&P 500 on pace for a five-day losing streak, several investors are probably looking at losses in their portfolios, and then looking over at the stocks that have been rallying and wondering why they don’t own those. One good answer is that outside of the last week, they were terrible! The table below lists the 20 best-performing stocks in the S&P 500 over the last week. Overall, the 20 stocks listed are up an average of 7.6% (median: 5.5%). At the sector level, nine of them come from the Health Care sector, and another six come from the Technology sector. The remaining five are spread out across four different sectors. What stands out, though, is that the 20 best-performing stocks over the last five days have been terrible performers so far in the quarter. From the end of June through 8/14, they declined an average of 11.5% (median: -9.2%), and only four were up. So, sure, owning them over the last week would have been nice, but you weren’t having a very good summer before the last five trading days.
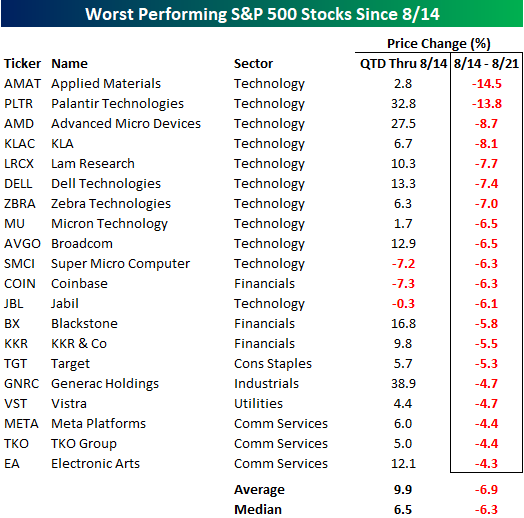
Conversely, the worst 20 performers since the S&P 500’s losing streak started had seen strong gains QTD through 8/14. As shown in the table below, their average gain was 9.9% (median: +6.5%), and only three were down. At the sector level, more than half of the worst performers over the last five trading days are all from the Technology sector, including the ten worst performers!

Aug 21, 2025
See what’s driving market performance around the world in today’s Morning Lineup. Bespoke’s Morning Lineup is the best way to start your trading day. Read it now by starting a two-week trial to Bespoke Premium. CLICK HERE to learn more and start your trial.
“Solving big problems is easier than solving little problems.” – Sergey Brin

Below is a snippet of commentary from today’s Morning Lineup. Start a two-week trial to Bespoke Premium to view the full report.
Futures are set for another lower open this morning, just as the Fed kicks off its annual Jackson Hole symposium and tomorrow’s speech by Fed Chair Powell. Shares of Walmart (WMT) are down close to 4% after the company reported weaker-than-expected EPS. If the stock closes down today, it would mark the third consecutive negative reaction to earnings, the longest such streak since 2021. Outside of WMT, the earnings calendar is relatively quiet this morning, but it’s a busy day for economic data, with jobless claims (higher than expected) and the Philly Fed (weaker than expected) at 8:30, PMIs at 9:45, and then Leading Indicators and Existing Home Sales at 10:00 AM.
The weakness in US futures follows what has been a weak morning in Europe, where the STOXX 600 is down 0.3% while Asian stocks were mixed, with Japan falling 0.7% and China, India, and South Korea all finishing the session with modest gains.
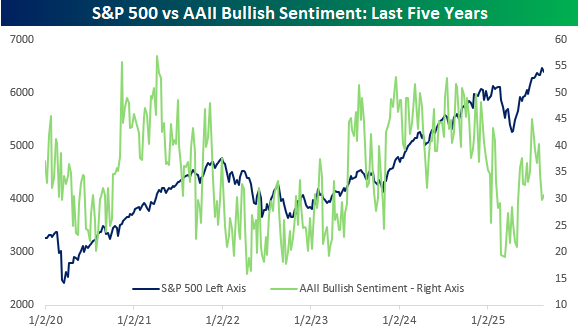
A four-day losing streak for the S&P 500 hasn’t done much to improve what has already been subdued sentiment on the part of individual investors. In this week’s survey from AAII, bullish sentiment rose slightly to 30.8% from 29.9% but with the S&P 500 within 2% of 52-week highs, investors aren’t happy. As shown in the chart below, a similar divergence emerged between equities and bullish sentiment earlier in the year, right before the market started to unravel. Then again, from early in 2021 and throughout the year, sentiment steadily deteriorated while the market just marched higher.
It’s been a mixed picture in terms of sector performance over the last week. Technology (XLK) has been the biggest loser, declining 3.2%, moving it out of overbought territory. Besides tech, the only other sector down more than 1% is Communication Services (XLC), while Consumer Discretionary (XLY) and Materials (XLB) are down just shy of a percent. At the other end of the spectrum, it has been defensive sectors holding up the best, just as you would expect during a market pullback. Health Care (XLV), the only sector down YTD, is up 3.2% while Real Estate (XLRE) and Consumer Staples (XLP) are the only two other sectors that have gained more than half a percent.
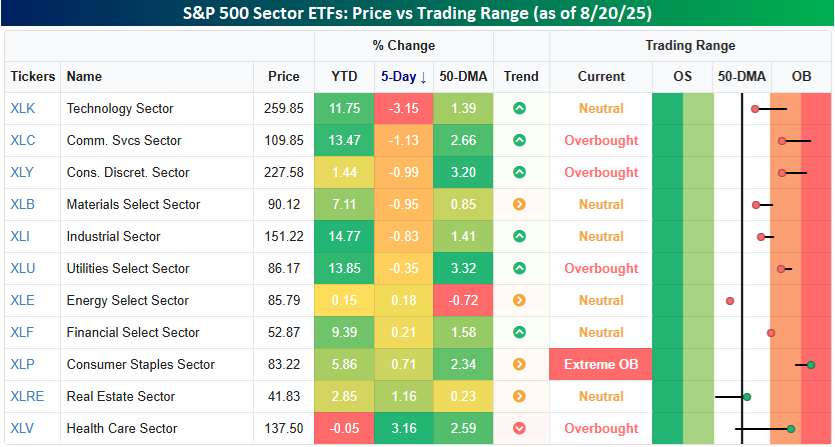
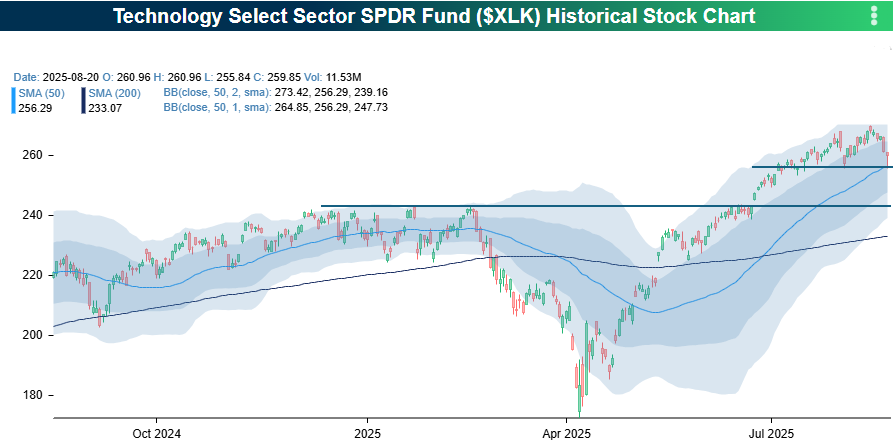
Looking at the Tech sector, at one point in yesterday’s sell-off, it tested its 50-day moving average and short-term support that coincides with other low points since the start of the second half. If these levels don’t hold, the next area to look at would be the high from earlier in the year, right before markets started to roll over. Those levels are about 7% below yesterday’s close.
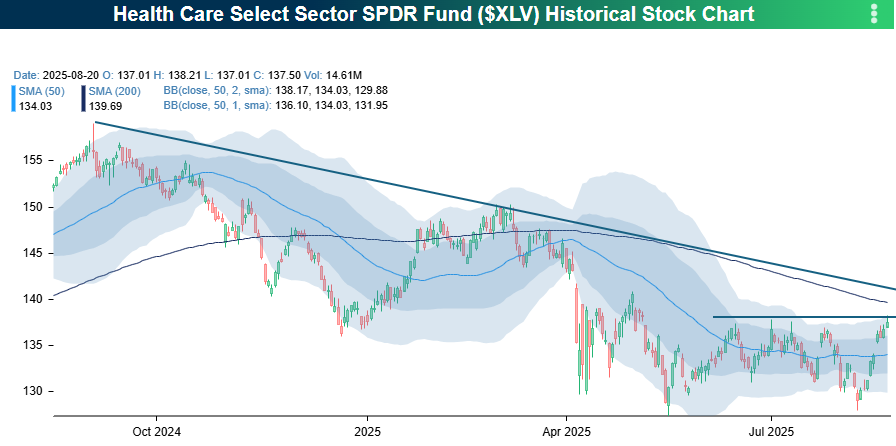
Health Care has been a completely different animal. After testing support near 52-week lows last week, the sector has now rallied back to the high end of its post-Liberation Day range. If it can break through those short-term resistance levels, the next areas to watch will be the 200-DMA, which is about 1% above yesterday’s close. After that, the downtrend line in place for a year now would be the next area to watch. If the sector can break through all these levels, we may finally be able to say that the sector is on the mend!
Aug 20, 2025
See what’s driving market performance around the world in today’s Morning Lineup. Bespoke’s Morning Lineup is the best way to start your trading day. Read it now by starting a two-week trial to Bespoke Premium. CLICK HERE to learn more and start your trial.
“Only in America can you find so many angry people claiming to love their country, while hating almost anyone in it.” – Don King
Below is a snippet of commentary from today’s Morning Lineup. Start a two-week trial to Bespoke Premium to view the full report.
Futures are modestly lower this morning after a weak day for momentum and megacap stocks yesterday. There’s only been a handful of earnings reports this morning, and the market reaction to them has been mixed. On the positive side, shares of Analog Devices (ADI), TJX, and Lowe’s (LOW) are all higher, while Estee Lauder (EL) and Target (TGT) are both down sharply. For both of these stocks, the negative reactions aren’t exactly a surprise, as they have been weak for some time now. EL is on pace now for its sixth straight negative reaction to earnings and the 11th out of the last 12. TGT hasn’t been quite as much of a disaster, but today will be the fourth straight quarter that the stock has reacted negatively to earnings.
Besides these earnings reports, there’s not much else on the calendar for today. Weekly mortgage applications fell 1.4% after a 10%+ increase last week. We’ll also get the FOMC Meeting Minutes at 2 PM, along with speeches from Waller at 11 AM and Bostic at 3 PM.
In Asia overnight, the session was mixed, with China up 1% and Japan down 1.5%, as trade data was weaker than expected. In Europe, major averages are little changed as the STOXX 600 is up fractionally, as CPI was in line with expectations (0.0% m/m).
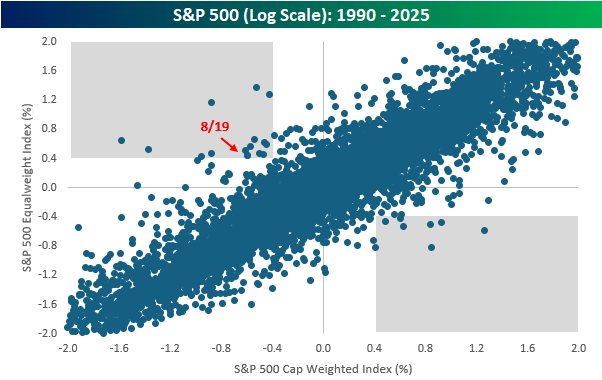
Depending on how you look at it, yesterday could have been a good or bad day. Based on the S&P 500’s 0.59% decline, it looked like a bad day, but underneath the surface, 354 stocks in the index finished the session higher, and the equally-weighted S&P 500 finished the day up 0.45%.
Divergent days like yesterday, where the cap-weighted index declines at least 0.4% while the equal-weighted index rises at least 0.4% have been very uncommon. Since 1990, yesterday was only the 16th occurrence, and there have only been eight days where the opposite occurred (cap-weighted index up 0.4%+ and equal-weight index down at least 0.4%).
The scatter chart below compares the daily performance of the S&P 500 cap-weighted and equal-weighted indices for every day since 1990, but we have truncated the axes at gains or losses of 2% so it’s easier to see the details. Dots that fall in the upper left gray box were like yesterday, where the cap-weighted index fell 0.4%+ and the equal-weight index rallied at least 0.4% while dots in the lower right box are the opposite scenario. Here again, this chart shows just how uncommon these types of daily divergences have been over time.
Aug 19, 2025
This content is for members only
Aug 19, 2025
See what’s driving market performance around the world in today’s Morning Lineup. Bespoke’s Morning Lineup is the best way to start your trading day. Read it now by starting a two-week trial to Bespoke Premium. CLICK HERE to learn more and start your trial.
“A lot of people are scared to ask questions because they don’t want people to know how dumb they are. I’ve never had that problem.” – Ken Langone
Below is a snippet of commentary from today’s Morning Lineup. Start a two-week trial to Bespoke Premium to view the full report.
Home Depot (HD) kicked off retailer earnings week this morning and reported weaker-than-expected EPS on slightly weaker-than-expected revenues. That’s the bad news. On a positive note, the company reaffirmed its guidance for the full year, and while most companies missing results this earnings season have been pummeled on their earnings reaction days, shares of HD are trading more than 1% higher in the pre-market. HD earnings have had little impact on futures, which are mixed on either side of the flatline. That follows what was a fractionally negative overnight session in Asia, and a fractionally positive session so far in Europe.
Here in the US this morning, besides the HD earnings report, there hasn’t been much in the way of stock-specific news. On the economic calendar, July Building Permits and Housing Starts will hit the tape at 8:30. Heading into those reports, bonds are trading slightly higher, crude oil is down 1%, gold and other precious metals are modestly high, while Bitcoin and Ether continue their recent weakness with declines of roughly 1%.
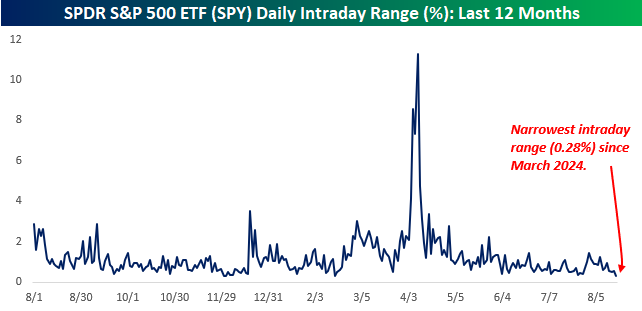
Yesterday was a tough day in the market – to stay awake. From the opening to closing bell, the SPDR S&P 500 ETF (SPY) traded in a range of 0.28% which was the narrowest intraday range since March 2024. To put yesterday’s range in perspective, the intraday range of the market on April 9th at the height of the tariff drama was more than 40 times larger.
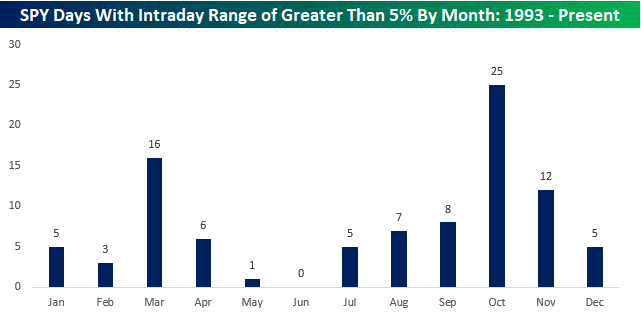
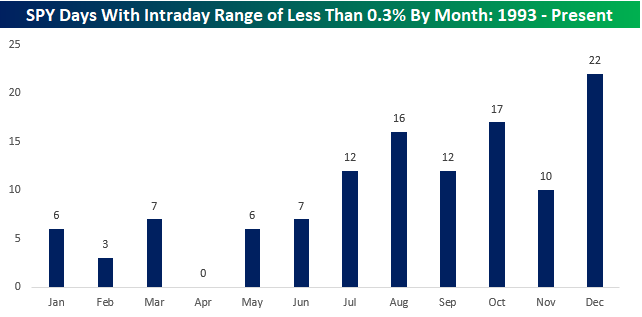
Given that we’re in August, it shouldn’t come as too much of a surprise that the market has been quiet. Since the launch of SPY back in 1993, August has seen the third-highest frequency of days when the ETF’s intraday range was narrower than 0.3%. The only two months with a higher frequency were October (17) and December (22). December makes sense given the holidays, but the fact that October has had the second-highest frequency of days with an intraday range of less than 0.3% was surprising. Digging a little deeper, we found that more than half of them (9) occurred in October 2017. That could have been the most docile month of trading in SPY’s history!
On the flip side, just for fun, we also looked at which months most frequently have seen 5% intraday ranges in SPY. Unsurprisingly, October has been the clear leader with 25, followed by March with 16. Here again, the high frequency of occurrences in March is primarily due to 2020, when there were 12, and the only four other occurrences were in 2009, around the lows of the Financial Crisis.