Nov 5, 2025
When it comes to whatever area of the technology sector is popular, it’s usually safe to assume that Japanese billionaire Masayoshi Son’s investment holding company SoftBank is active in it. The company always rides the wave when certain tech sectors get hot, but it’s usually along for the ride as the wave crests and starts to roll over. The last several weeks provide an excellent example.
From the April low through its recent intraday high a week ago today, shares of SoftBank rallied more than 380% in the span of just over six months! However, as investors start to question the valuations of AI-related stocks and cryptocurrencies, the stock has quickly corrected. Shares kicked off the week on Tuesday (Monday was a holiday in Japan) by declining 7% and followed that up with an even larger encore overnight, falling more than 10% today. On both a one-day and two-day basis, the declines rank as the steepest since the April lows.
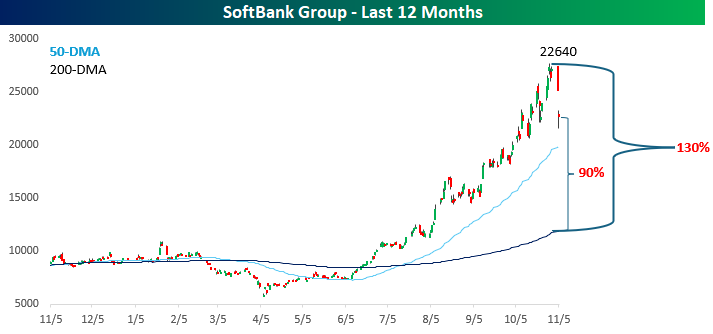
What’s bananas about SoftBank, though, is that even after the declines in the last two days, the stock is still 90% above its 200-day moving average (DMA)! Robinhood (HOOD), the best performing stock in the S&P 500 this year, is ‘only’ 65% above its 200-DMA, so 90%, let alone the 130% that SoftBank was trading above its 200-DMA last week, is incredible.
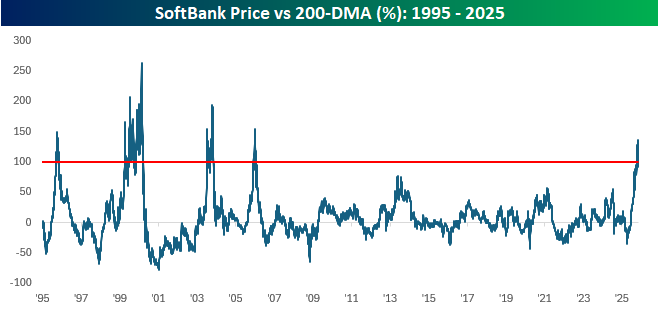
Relative to its own history, SoftBank’s recent peak of trading 130% above its 200-DMA was the widest spread since December 2005, when its 200-DMA spread reached 154%. Believe it or not, that wasn’t even the stock’s peak. In 2003, the spread reached 190%, and at the height of the dot-com bubble, the spread surged to 262%, or double what the spread just recently peaked at. Double! When it comes to investing, most advisors suggest that slow and steady wins the race, but Masayoshi Son has shown that there are other ways to get from here to there.
Not a Bespoke client? We’d love for you to give our equity research platform, Bespoke Premium, a try. You can sign up for complimentary access for 14 days at this link to start receiving our daily emails today!

Nov 4, 2025
See what’s driving market performance around the world in today’s Morning Lineup. Bespoke’s Morning Lineup is the best way to start your trading day. Read it now by starting a two-week trial to Bespoke Premium. CLICK HERE to learn more and start your trial.
“America’s health care system is neither healthy, caring, nor a system.” – Walter Cronkite

Below is a snippet of commentary from today’s Morning Lineup. Start a two-week trial to Bespoke Premium to view the full report.
After a strangely subdued reaction to its earnings report after the close yesterday, shares of Palantir (PLTR) are down nearly 8% in the pre-market as investors had some time to sleep on it overnight. An 8% decline is nothing to dismiss, but it’s also important to remember that PLTR is a volatile stock. In its history as a public company, the average one-day reaction to earnings has been a gain or loss of over 15%, and based on where it’s trading now, shares of PLTR are back to where they were just last Tuesday.
The decline in PLTR comes as a cloud of concern envelops the market over how fast stocks have rallied and where valuations have gone. Right on cue, a Bloomberg article says as much with the headline below. While the headline sounds scary enough, the details read a lot less scary. Essentially, it quotes various Wall Street CEOs, among them Morgan Stanley CEO Ted Pick and Goldman Sachs CEO David Solomon, suggesting that the market could see a pullback of 10% to 20% at some point in the next 12 to 24 months. Solomon was quoted as saying, “Of course, it’s likely there will be a 10% to 20% drawdown in equity markets over the next 12 months,” but even he admitted that pullbacks like that can come at any time and from any level.

Concerns are concerns, though, and when investors worry, they sell. With that, futures on the S&P 500 and Nasdaq are both indicated to open down by more than 1%, following a down session in Asia and Europe, where stocks are also broadly lower by around 1% or more.
Even with the sharp decline in equities, bond yields are only modestly lower as the 10-year yield still hangs around 4.1%. Crude oil prices are also down more than 1%, which suggests that investors are also concerned about the health of the economy, given the ongoing shutdown. We’ll be watching the level of airport delays; the more they rise, the more likely it is that policymakers in DC reach an agreement to open the government back up. Thanksgiving is just three weeks away, and no one on either side of the aisle wants to face the wrath of Americans who can’t get home for the holiday.
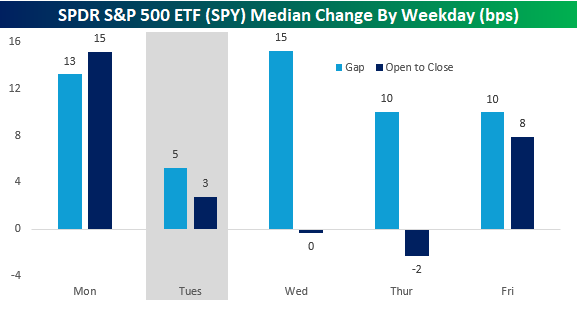
Given the scope of the pre-market declines, it must be Tuesday. As shown in the chart below, the S&P 500’s median opening gap on Tuesdays this year has been just five basis points (bps), which is less than half the next closest weekdays (Thursdays and Fridays), so the day has had a knack for weakness. From the open to close, Tuesday isn’t the weakest day of the week, but it’s still much weaker than the median gains of 15 bps on Monday and 8 bps on Friday.
Nov 3, 2025
See what’s driving market performance around the world in today’s Morning Lineup. Bespoke’s Morning Lineup is the best way to start your trading day. Read it now by starting a two-week trial to Bespoke Premium. CLICK HERE to learn more and start your trial.
“It would be a mistake to think something is wonderful just because it looks great.” – Anna Wintour
Below is a snippet of commentary from today’s Morning Lineup. Start a two-week trial to Bespoke Premium to view the full report.
Last week may have been the peak week of earnings season in terms of the market cap of companies reporting, but we have another busy week in store for investors, and it’s picking up right where it left off last week. Of the companies reporting so far today, 89% have reported better than expected EPS forecasts, and 75% have topped sales forecasts, so you can’t ask for much more than that. Even in terms of guidance, 3 companies have raised forecasts while only one lowered.
In response to the better-than-expected reports, equity futures are also picking up right where they left off last week, as markets look to open the week higher with the Nasdaq leading the way. Today’s positive open for the Nasdaq will be the ninth straight positive start to a week for the index, which is only the longest streak since summer 2024, but still tied for the second longest in the index’s history.
In Asia, Japan was closed for the day, but other indices in the region were broadly higher even as South Korea’s manufacturing PMI moved into contraction territory. In Europe, most manufacturing PMIs were also in line with forecasts, and the STOXX 600 responded by rallying 0.5% while Germany rallied more than 1%.
Outside of equities, the 10-year yield is slightly lower at 4.09% ahead of a busy week for Fed speakers, who have mostly sounded more skeptical of a December rate cut, as concerns over inflation linger even as there are signs that the labor market is stabilizing.
Crude oil prices are essentially unchanged even as OPEC+ announced over the weekend that it would increase output by 137K barrels per day, but then pause those increases beginning in January. WTI is starting the month just over $60 per barrel after declining 2% in October, taking its monthly losing streak to three months.
Gold prices are starting off the month back above $4,000 per ounce as other metals also trade higher, but the troubles for digital gold continue as bitcoin prices trade down close to 2% and barely hangs on to $108K. Ethereum prices are down twice as much as they barely hang on to $3,700.
With just two months left in the year, over the weekend, we looked at asset class performance, country performance, and individual stock performance for October and various other time periods. Make sure to take a look at that rundown of where things stand heading into year-end. Even though the major averages may be looking good, not everything looks great.
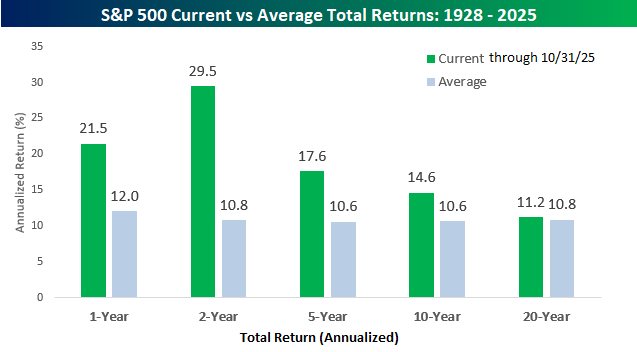
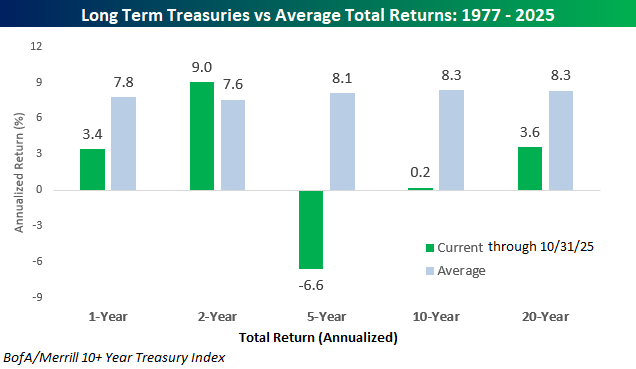
Taking a high-level look at equity market returns, whether you’re looking at the short-term or long-term, it has been a friendly environment. Over the last year, the S&P 500’s total return has been a gain of 21.5% which is nearly twice the historical average of 12.0%, but over the last two years, the 29.5% annualized gain has been nearly triple the long-term average. Looking out over longer-term time periods, though, over the last five, ten, and twenty years, returns aren’t as strong, but they’re still above the long-term average.
While equity market investors have been on a highway paved in green, the treasury market has been a world of pain. Over the last year, long-term treasuries, as measured by the BofA/Merrill 10+ Year Treasury Index, have posted positive returns, but at 3.4% it’s still less than half of the long-term average. Over the last two years, the annualized gain of 9.0% is actually slightly above average. Still, looking back further than that, it’s been a painful five, ten and twenty years for anyone who has loaned money to the US Treasury.
Oct 31, 2025
October is winding down, and while investors braced for volatility this month, they got off relatively easy. From its MTD high (at the time) on 10/9 to its intraday low on 10/10, the S&P 500’s maximum drawdown from a high was 3.16%, While last October’s maximum drawdown of 2.99% was smaller, this month’s max decline was 1.44 percentage points less than the median maximum drawdown of 4.60% seen during the month dating back to 1983, which is as far back as we have intraday price history for the S&P 500.
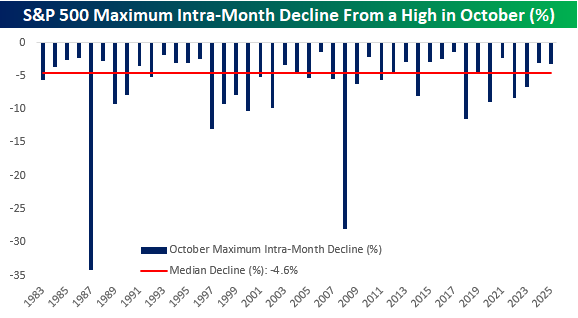
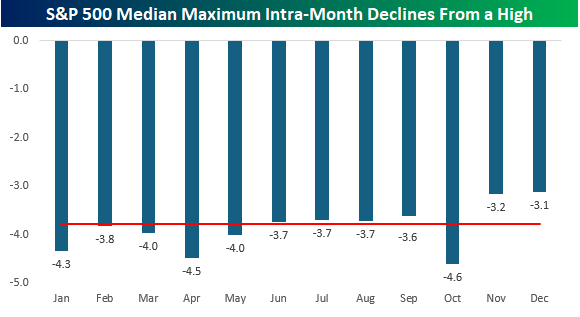
October is known as the most volatile month, and history backs that up. As shown in the chart below, no other month has experienced a larger median maximum drawdown. Somewhat surprisingly, though, April at -4.5% and January at -4.3% aren’t far behind. What makes the month seem even more volatile than it is, though, is that for anyone who has been around a while, two of the three largest intra-month drawdowns from a high have both occurred in October. In 1987, the S&P 500 declined by more than 34% from peak to trough, while in 2008, it plunged by 28%. The only other months with an intra-month decline of more than 25% were March 2020 (-30.12%) when Covid shut down the economy and November 2008 (-26.45%) during the Financial Crisis. It isn’t always a crazy month, but when it is, October sure knows how to disappoint!
Not a Bespoke client? We’d love for you to give our equity research platform, Bespoke Premium, a try. You can sign up for complimentary access for 14 days at this link to start receiving our daily emails today!