Sep 18, 2025
To read our weekly Bespoke Report newsletter and access everything else Bespoke’s research platform offers, start a two-week trial to Bespoke Premium. This week, we review the consistently overbought nature of the market, demand for equities, the FOMC’s resumption of rate cuts, the state of the economy, where breadth stands, and finally, a review of one and five-year charts of the major indices, sectors, and asset classes. Give it a read!

Sep 18, 2025
See what’s driving market performance around the world in today’s Morning Lineup. Bespoke’s Morning Lineup is the best way to start your trading day. Read it now by starting a two-week trial to Bespoke Premium. CLICK HERE to learn more and start your trial.
“He who waits to do a great deal of good at once will never do anything.” – Samuel Johnson

Below is a snippet of commentary from today’s Morning Lineup. Start a two-week trial to Bespoke Premium to view the full report.
Investors apparently slept on the Fed’s announcement yesterday and woke up in a good mood. The S&P 500 is on pace to open up by 0.75% this morning, while the Nasdaq is on track to open up by more than 1%, and small caps are leading the way with a gain of 1.25%. The US strength follows what was a mostly positive night in Asia, where China was the only country to trade lower, while Japan and Korea both shot higher by over 1%. The strength in Japan came even as Machinery Orders fell 4.6% m/m compared to forecasts for a drop of just 1.8%. In Europe, stocks are also higher across the board as the STOXX 600 rallies 0.8%.
This morning in the US, there’s little in the way of earnings data, and the only reports on the economic calendar are jobless claims at 8:30 and the Philly Fed and Leading Indicators at 10 AM.
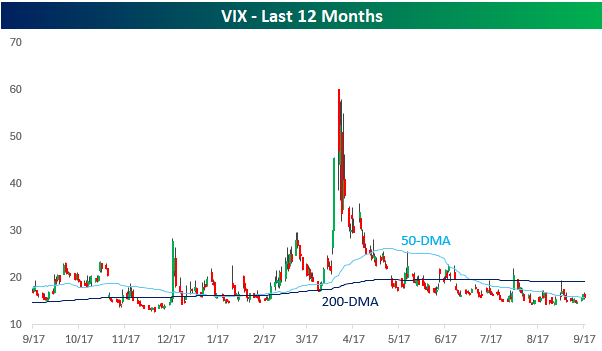
Like the quote above, the market’s grind higher for the last several months has been more gradual than a move concentrated into a handful of days. There are several ways to illustrate this, and we’ll start with the VIX. At 14.8 this morning, the VIX is on pace for its lowest close since late August, not exactly a level you would expect for what historically has been one of the most volatile months of the year. As shown in the chart below, if the VIX was an EKG, we’d be putting a sheet over the patient as it has flatlined since first falling back below its 200-DMA in June.
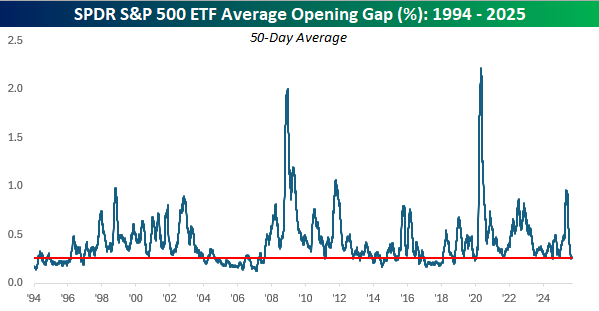
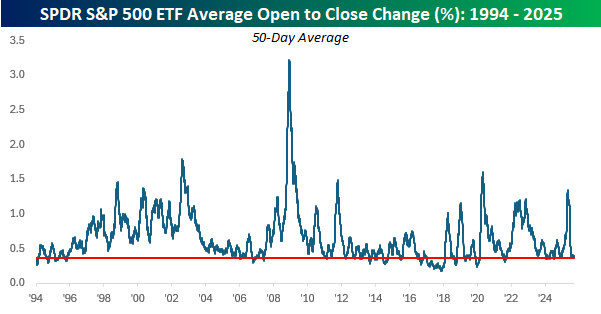
In addition to the low VIX, another example of the gradual moves is by looking at the S&P 500’s average opening gap. Using SPY as a proxy, the S&P 500’s average change at the open relative to the prior days’ close over the last 50 trading days has been 0.25%, and there has only been one day when the S&P 500 gapped up or down more than 1% (9/2/25: -1.17%). After volatility at the open rocketed to the highest levels since COVID back in April, the average daily change has sunk like a stone to some of the lowest levels of the last five years.
Just as volatility has been subdued at the opening bell, it has also been tamed during regular trading hours. Just like the average opening gap, intraday volatility shot higher in April only to come crashing down in the summer to around the lowest levels of the last five years. The old cliché says to never short a dull market, and that’s the only piece of advice an investor has needed over the last few months.
Sep 17, 2025
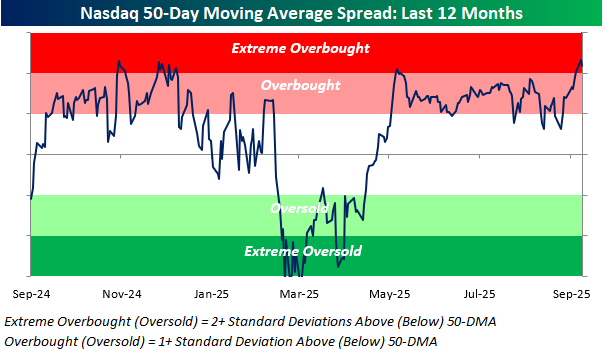
The chart below shows the Nasdaq’s daily close relative to its trading range expressed in terms of standard deviations relative to its 50-day moving average (DMA). We also update a similar chart for the S&P 500 every day in our Morning Lineup. When the line is in the white zone, it indicates that the Nasdaq is trading within its normal trading range (less than one standard deviation above or below the 50-DMA). When it rises into the red zones, it indicates various levels of overbought, while readings in the green zones represent short-term oversold levels. Heading into this morning, the Nasdaq was firmly into ‘extreme’ overbought territory (2+ standard deviations above its 50-DMA) after trading almost exclusively at overbought levels for the last four months.
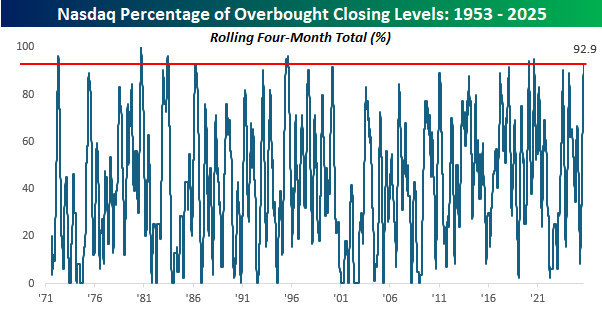
Normally, overbought or oversold levels revert to the mean over time, so situations like the present are very unusual. Over the last four months, the Nasdaq has closed at overbought levels on just under 93% of trading days. While readings this high aren’t unprecedented, they are rare. In fact, there hasn’t been a higher frequency of overbought daily closes for the Nasdaq in a four-month window since August 2020, and the reading has only been above 85% on 0.04% of all trading days in the Nasdaq’s history. Overbought markets can’t stay overbought forever, so eventually we’ll see the market pull back from these levels, but for now, it’s been an unbelievable run.

Sep 17, 2025
See what’s driving market performance around the world in today’s Morning Lineup. Bespoke’s Morning Lineup is the best way to start your trading day. Read it now by starting a two-week trial to Bespoke Premium. CLICK HERE to learn more and start your trial.
“To hell with facts! We need stories!” – Ken Kesey
Below is a snippet of commentary from today’s Morning Lineup. Start a two-week trial to Bespoke Premium to view the full report.
The long-awaited Fed decision day has arrived, and despite an Atlanta Fed GDPNow forecast for growth of 3.4% in Q3, stronger-than-expected retail sales in August, still relatively low (but admittedly rising jobless claims), and higher-than-normal inflation, the Fed will likely cut rates this afternoon. That’s not to say there is no justification for a rate cut. Continuing jobless claims remain elevated, job growth has practically evaporated, and both the manufacturing sector of the economy and housing remain weak. Additionally, other secondary indicators, such as heavy truck sales, have been particularly weak. There are very few people who would say that the Fed should not be cutting rates today, but given how fast sentiment towards rate cuts has shifted, it’s hard to argue that the President using the bully pulpit of the White House hasn’t at least played in role in shifting the conversation.
Heading into today’s session, equity futures are modestly negative along with treasury yields, crude oil, gold, and crypto. Housing Starts and Building Permits were also just released, and both reports missed expectations by a relatively wide margin, providing more justification for a cut today.
Overnight in Asia and this morning in Europe, equity markets had mixed returns. CPI in the Eurozone came in lower than expected, while it was hotter than expected in the UK. On a y/y basis, CPI for the Eurozone came in slightly lower than expected at 2.0% compared to forecasts for 2.1%.
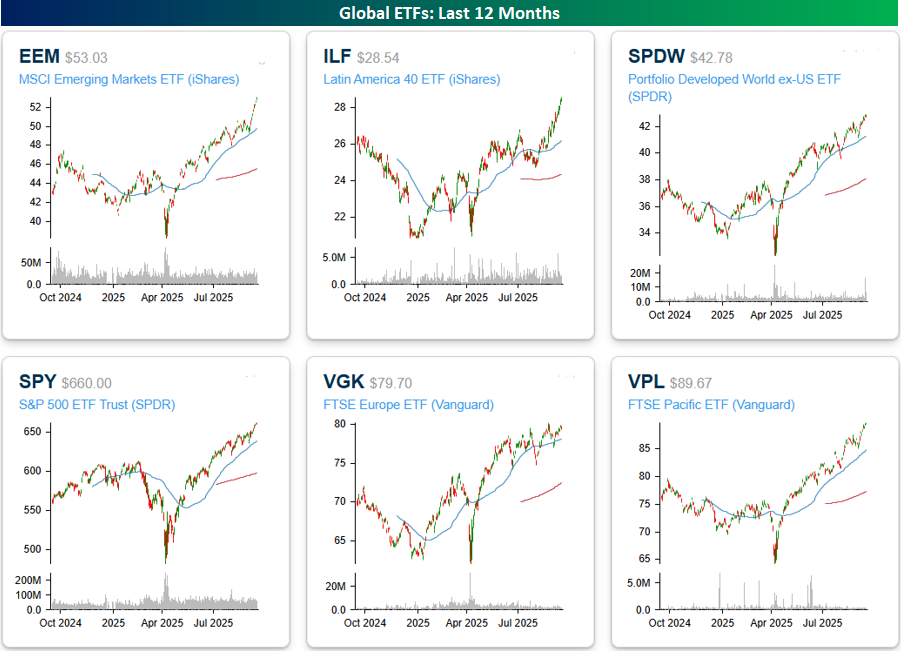
As we head into this afternoon’s expected rate cut from the Federal Reserve, US stocks have been in rally mode, but they’re not alone, at least from the perspective of a US investor. The snapshot below from our Trend Analyzer shows where various global ETFs closed yesterday relative to their short-term trading ranges. The S&P 500, as measured by the SPDR S&P 500 ETF (SPY) is up 1.5% over the last five trading days and closed yesterday in ‘extreme’ overbought territory (more than 2 standard deviations above its 50-DMA), but it’s not the only one and certainly not the best performer. Of the ETFs shown in the spotlight, three have outperformed the US over the last week, and SPY is the worst performer on a YTD basis.
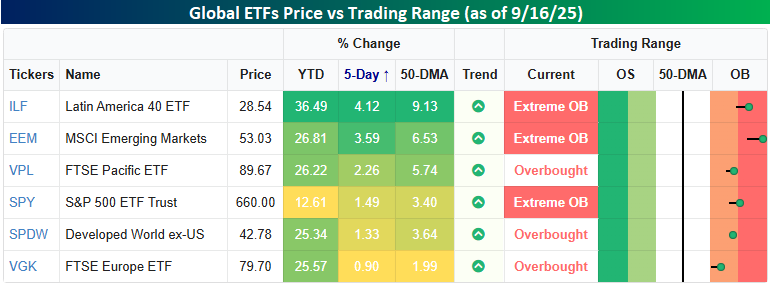
A look at one-year price charts of all six ETFs shows that they’re all either at or right near 52-week highs heading into today’s session. The only difference is the slope of their advances heading into those highs. The MSCI Emerging Markets ETF (EEM) and the Latin America 40 ETF (ILF) have been moving almost vertically over the last couple of weeks, while the FTSE Europe ETF (VGK) has been moving in more of a sideways range.