Sep 29, 2025
See what’s driving market performance around the world in today’s Morning Lineup. Bespoke’s Morning Lineup is the best way to start your trading day. Read it now by starting a two-week trial to Bespoke Premium. CLICK HERE to learn more and start your trial.
“Never make anything more accurate than it needs to be.” – Enrico Fermi

Below is a snippet of commentary from today’s Morning Lineup. Start a two-week trial to Bespoke Premium to view the full report.
After last trading to record highs last Monday, US equities are kicking off the week on a positive note once again this week as deal-making activity provides a boost to investors concerned about market valuations. Both the S&P 500 and the Nasdaq are indicated to open up by over 0.50%. Crude oil is down over 2%, which also helps, while gold is up over 1% and Bitcoin and Ethereum are both up close to 2% after some rough trading last week.
The pace of earnings activity will be incredibly slow this week, with Nike (NKE) the only notable report of the week (Tuesday). Economic data will pick up the slack, though, with multiple PMI readings, Consumer Confidence, and Non-Farm Payrolls.
Like the S&P 500, which hit an all-time high last week before pulling back modestly, the Philadelphia Semiconductor Index (SOX) also hit an all-time high last Monday and then pulled back a little bit but still managed to finish the week up by 1.2%. What’s been interesting about the SOX this year, though, is which stocks are leading. A list of some of the index’s best performers this year looks like a time warp from the late 1990s, with stocks like Rambus (RMBS), Micron (MU), Lam Research (LRCX), and Intel (INTC) all up over 75%! INTC was up over 20% just last week! Meanwhile, Nvidia (NVDA), the leader of the AI revolution, has been in the middle of the pack, managing a gain this year of ‘only’ 33%.
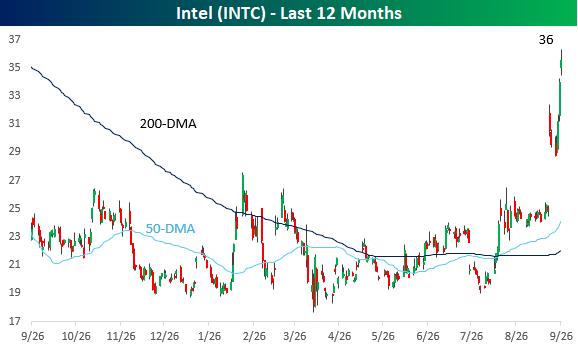
On a one-year basis, INTC’s chart looks a lot like ones from the 1990s as the stock has gone parabolic over the last two months, surging close to 90%!
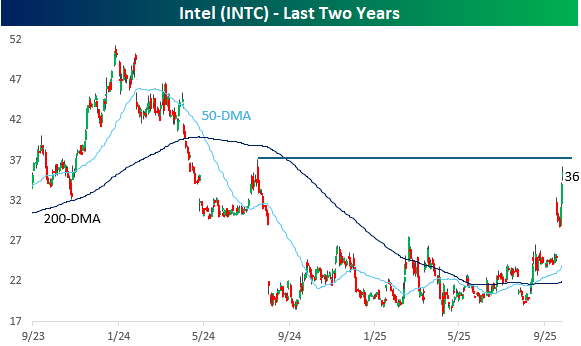
On a two-year basis, INTC’s move looks more modest. Last Friday’s surge topped out just shy of the high it reached in the summer of 2024 right before it plunged 50% in a matter of weeks!
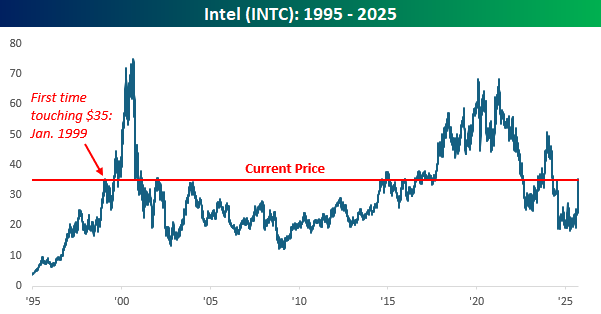
As impressive as INTC’s run has been in the last couple of months, it is still a shell of its former self. It’s still down close to 50% from its high in 2021. Additionally, while there has been a lot of talk lately about the market feeling like 1999, with INTC closing at $35 and change last Friday, it’s back to levels it first crossed back in January 1999!
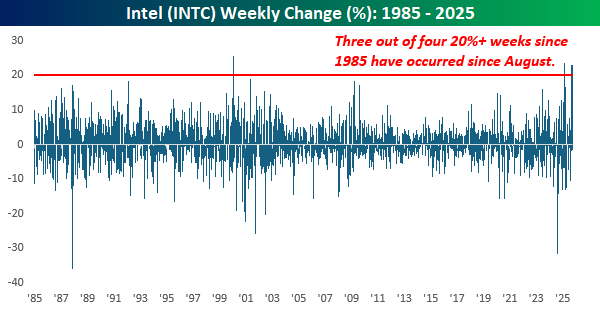
Perhaps the most amazing thing about the recent moves in INTC is that last week’s gain of 20% was the third week in the last seven that the stock rallied 20%+. How crazy is that? Since 1985, there has only been one other week outside of the last seven that the stock rallied 20%+.
Sep 26, 2025
Our Matrix of Economic Indicators provides a concise summary analysis of the US economy’s momentum. We combine trends across the dozens and dozens of economic indicators in various categories like manufacturing, employment, housing, the consumer, and inflation to provide a directional overview of the economy.
To access our newest Matrix of Economic Indicators, start a two-week free trial to either Bespoke Premium or Bespoke Institutional now!
Sep 26, 2025
See what’s driving market performance around the world in today’s Morning Lineup. Bespoke’s Morning Lineup is the best way to start your trading day. Read it now by starting a two-week trial to Bespoke Premium. CLICK HERE to learn more and start your trial.
“This is the way the world ends, not with a bang but a whimper.” – T.S. Eliot
Below is a snippet of commentary from today’s Morning Lineup. Start a two-week trial to Bespoke Premium to view the full report.
Futures were higher heading into this morning’s economic data, and after the 8:30 batch of data, equities have built modestly on their gains. Personal Income and Personal Spending were both a tenth higher than expected, and PCE inflation was in line with forecasts at both the headline and core levels. While the inflation data was right inline, it remains at uncomfortably high levels with y/y headline coming in at 2.7% while the core reading was 2.9%. As long as these readings can stay below 3%, markets should be able to handle it.
Mondays aren’t usually a day we look forward to, but looking back, it’s been the best day of the week. After riding the optimism of Fed rate cuts to record highs last week, investors took the weekend to think about it and liked what they saw. On Monday, the S&P 500 rallied for the third day in a row, hitting its eighth record high of the month and the 28th record high of the year.
Since that record high on Monday, however, the S&P 500 has traded down for three straight days and is now trading back to where it closed last Tuesday – before the Fed cut rates. Instead of optimism for lower rates, investors are increasingly worried that the market is getting ahead of itself as terms like euphoria and bubble enter the lexicon.
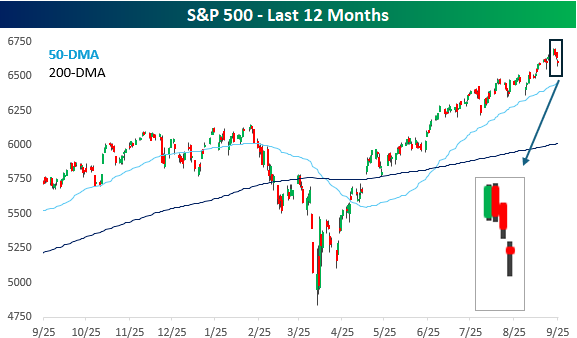
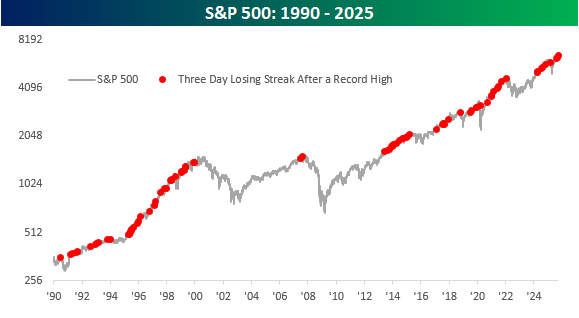
The severity of the declines this week has been extremely modest. Over the course of the three-day losing streak, the S&P 500 is down less than 1%, so if this type of ‘pullback’ makes you nervous, you’re taking too much risk. Besides the shallow nature of the decline, the fact that the S&P 500 is down three days in a row after hitting a record high is hardly unusual. The chart below shows the S&P 500 dating back to 1990, and the red dots show every three-day losing streak that followed a record closing high. Just this year, there have been three other occurrences. One occurred back in February ahead of the tariff-tantrum, but there was also another one in late July and then again in mid-August. Remember those? We didn’t either.
Looking at other occurrences, yes, similar scenarios have played out right around major market tops, but there were dozens more that no one remembers anymore. The only way we’ll know if this occurrence is a significant one is with hindsight, but the odds are that it’s not.
Sep 25, 2025
See what’s driving market performance around the world in today’s Morning Lineup. Bespoke’s Morning Lineup is the best way to start your trading day. Read it now by starting a two-week trial to Bespoke Premium. CLICK HERE to learn more and start your trial.
“The best fiction is far more true than any journalism.” – William Faulkner
Below is a snippet of commentary from today’s Morning Lineup. Start a two-week trial to Bespoke Premium to view the full report.
Just when it seems like the market can only go up, it does nothing but go down. Futures on the S&P 500 and Nasdaq are in firmly negative territory this morning, putting both indices on pace for their third straight day of losses. The S&P 500 is indicated to open down by about 0.4% while the Nasdaq is on pace to open down closer to 0.6%. The weakness in US stocks follows a weak morning in Europe, where the STOXX 600 is down over 0.75%, and other major country-level indices are down by 0.15% to 1.0%.
Despite the weaker tone in equities, investors aren’t rotating into treasuries as yields are modestly higher as well. Crude oil is also lower, although gold and other precious metals are all up at least 0.5%. One are where investors certainly aren’t rotating is into crypto. Bitcoin is down nearly 2% while Ethereum is down over 3.7% as it struggles to hang onto the $4,000 level. There may have been a decent amount of froth in the sector heading into the month, but it has definitely worked itself off over the last several days.
We also have a ton of economic data to contend with this morning, with Wholesale Inventories, GDP, Personal Consumption, Durable Goods, and Jobless Claims at 8:30, followed by Existing Home Sales at 10 and the KC Fed Manufacturing report at 11. Besides those reports, there are also a ton of Fed speakers on the calendar. Should be fun! Of the reports hitting the tape at 8:30, most of them came in better than expected, with a much weaker-than-expected initial jobless claims reading of 218K being the big standout. The market response has been even higher yields and lower futures.
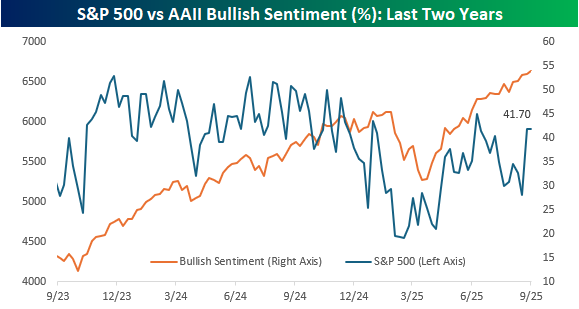
While the last couple of days have started to show some cracks in the market, sentiment was little changed based on the weekly survey from the American Association of Individual Investors (AAII). Bullish sentiment remained unchanged at 41.7% while bearish sentiment dropped to 39.2% and neutral sentiment increased to 19.1%. As shown in the chart below, even as stocks have recovered from their April lows, sentiment hasn’t experienced anywhere nearly as big a lift.
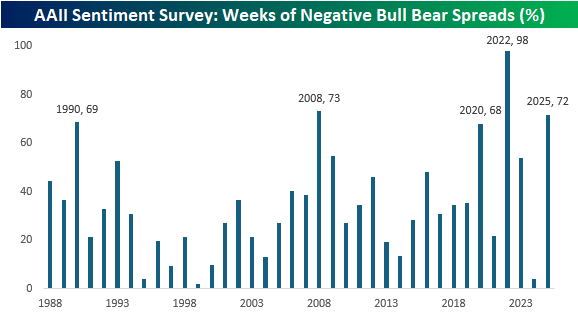
In fact, while the bull-bear spread in sentiment broke a streak of seven weeks in a row of negative readings, nearly three-quarters of all weeks this year have had negative spreads, and if the year were to end now, it would rank as the third-most weeks of negative bull-bear spreads in the survey’s history. The only years with a higher percentage were 2022, when the spread was only positive once (March 2022), and 2008, when 73% of weekly readings were negative. Outside of those two years, the only others when the bull-bear spread was negative more than two-thirds of the time were 1990 (69%) and 2020 (68%).
Sep 24, 2025
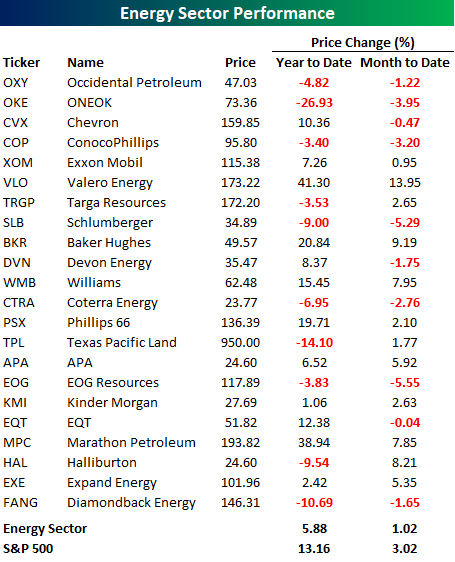
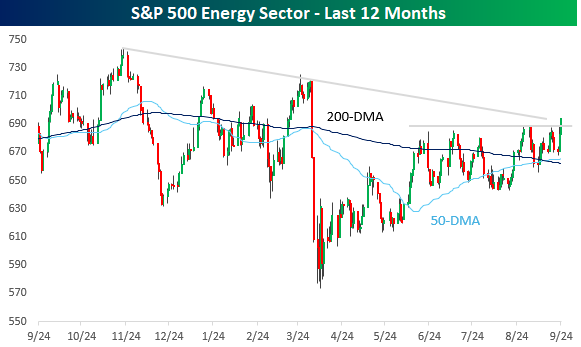
With a gain of less than 6% for the year, the Energy sector has been a big laggard, but with sectors like Technology and Communication Services starting to come under question for their valuations, investors are looking to other places for opportunities. Energy has been a beneficiary in the last few days. The sector has been meandering in a sideways range for the last three or four months, but just today, it broke above the high end of that range to its highest level since the tariff-tantrum in early April. Along with this new short-term high, the sector is also looking to test its downtrend line that has been in place since its high last fall.
In terms of performance, Energy stocks have been chronic underperformers this year and even this month. The table below lists the YTD and MTD performance of the sector’s 22 components. On a YTD basis, less than half of the sector’s components are outperforming the sector this year, and less than a quarter have outperformed the S&P 500. Even on a MTD basis, the sector’s 1.02% gain has lagged the broader market’s rally of over 3%. Similarly, just half of the sector’s components are outperforming the sector this month, and less than a third (32%) are outperforming the S&P 500. It’s somewhat ironic that even with a positive chart formation, the Energy sector is still underperforming the S&P 500 by a wide margin on both a YTD and MTD basis, but that only provides another example of how strong the overall market has been.