Feb 19, 2026
See what’s driving market performance around the world in today’s Morning Lineup. Bespoke’s Morning Lineup is the best way to start your trading day. Read it now by starting a two-week trial to Bespoke Premium. CLICK HERE to learn more and start your trial.
“To know that we know what we know, and to know that we do not know what we do not know, that is true knowledge.” – Nicolaus Copernicus

Below is a snippet of commentary from today’s Morning Lineup. Start a two-week trial to Bespoke Premium to view the full report.
It looks like a sluggish start to the trading day with S&P 500 futures down about 0.25% while the Nasdaq is down closer to 0.40%. Walmart (WMT) reported earnings earlier, and the stock is down over 2.5% after giving disappointing guidance. WMT’s reaction to earnings encapsulates the entire earnings season, where stock price reactions and the overall market performance have been modestly disappointing.
Treasury yields are higher again this morning as the 10-year yield moves above 4.10% just two days after it looked like we’d be trading with a 3-handle. Crude oil prices are rising again, with WTI up over $66 as investors watch the Middle East, where a US military strike against Iran looks increasingly likely. Gold prices are basically flat, while crypto is down modestly.
In Asia, China remained closed for the Lunar New Year, but South Korean stocks surged over 3% while the Nikkei rallied 0.6% after Core Machinery Orders rose more than 19% versus forecasts for an increase of 5.1%. Europe is following the US tone rather than Asia this morning, and the STOXX 600 is down 0.6%, led lower by Italy’s decline of 1.3%.
On the economic calendar, it’s been a busy morning, with the main reports being the Philly Fed Manufacturing report, which came in better than expected (+16.3 vs +7.5), and jobless claims. Initial claims were lower than expected at 206K versus forecasts for 225K, while continuing claims were slightly higher than expected at 1.869 mln versus forecasts for 1.860 million. For the rest of the day, the only remaining reports of note are Leading Indicators and Pending Home Sales at 10 AM
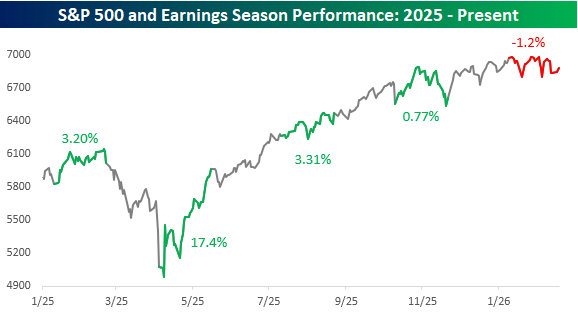
With Walmart’s report this morning, Q4 earnings season is now winding down to an unofficial close. We measure earnings season performance as the five weeks starting with the Friday before the large banks start to report, which for the current earnings season works out to the period from the close on 1/9 through 2/20. As of yesterday’s close, the S&P 500 was down 1.2%, and with futures down this morning, it would take a decent reversal and a rally tomorrow to push the S&P 500 into the green for this earnings season.
A negative earnings season would break a streak of five straight earnings seasons during which the S&P 500 had positive returns during earnings season. Even more notable is that the last time the market declined more than 1% during an earnings season was 15 quarters ago (nearly four years) during the Q1 2022 reporting period, when the S&P 500 fell more than 13%.
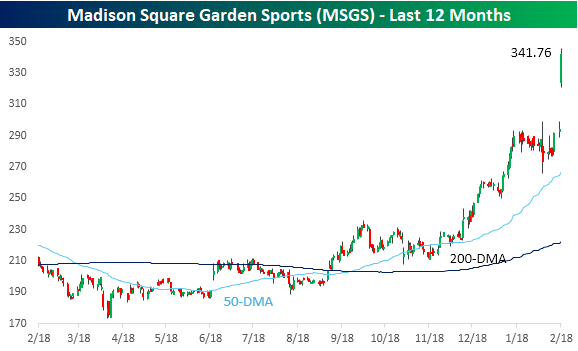
At the stock level, yesterday’s big story was news that Madison Square Garden Sports (MSGS), which owns the New York Knicks and New York Rangers, was considering a plan to separate the two franchises into two standalone companies. The stock rallied more than 15% in response, and deservedly so, as even after yesterday’s rally, MSGS has a market cap of less than $9 billion, and the combined value of both teams is estimated at well over $10 billion.
MSGS has been a solid performer over the last year as many investors started to anticipate this type of announcement from the company, and even before yesterday’s news, the stock was up over 42% in the last year. After yesterday’s surge, MSGS is up over 65%.
Owning sports franchises has become a popular investment strategy in recent years as their value has skyrocketed in the last couple of decades. Private equity funds have been rushing into the space, but as is usually the case for emerging investment trends, access for individual investors is tough. In the public equity space, there’s only a handful of stocks that primarily track the performance of individual sports teams or leagues.
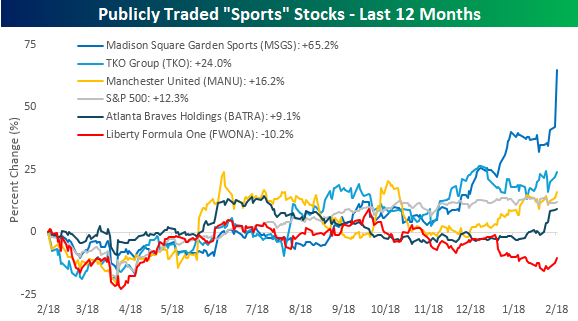
The chart below shows the performance over the last year of five publicly traded stocks that provide exposure to individual sports franchises or an entire league. While it’s been a popular investment strategy among the limited options available to individual investors, performance over the last year has been mixed.
Even before yesterday’s surge, shares of MSGS were the top performer, and they only added to the gains yesterday. Trailing MSGS, TKO Group (TKO), which owns the UFC and WWE, was up 24%, which also handily outperformed the S&P 500. Next on the list was Manchester United (MANU), and its 16.2% only modestly outperformed the S&P 500. While three of the five stocks have outperformed the S&P 500 over the last year, shares of Liberty – Atlanta Braves (BATRA) are up just 9.1%, while shares of Liberty Formula One (FWONA) have “crashed and burned” 10.2%. While Formula One is billed as one of the fastest-growing sports these days, its stock price has gone the other way.
Feb 18, 2026
See what’s driving market performance around the world in today’s Morning Lineup. Bespoke’s Morning Lineup is the best way to start your trading day. Read it now by starting a two-week trial to Bespoke Premium. CLICK HERE to learn more and start your trial.
“You just have to find that thing that’s special about you that distinguishes you from all the others, and through true talent, hard work, and passion, anything can happen.” – Dr Dre
Below is a snippet of commentary from today’s Morning Lineup. Start a two-week trial to Bespoke Premium to view the full report.
US equities are poised to open higher this morning, but futures are well off their overnight highs. As things stand, the S&P 500 is on pace for a 0.35% rally at the open while the Nasdaq is up 0.45%. The 10-year yield is up less than a basis point, but with the yield over 4.06%, it’s well off its intraday low of under 4.02% yesterday. Oil prices are up over 2.5% as markets remain on edge over the possibility of military action in Iran. That has also helped to push gold prices up over 1%, even as they remain under $5,000 per ounce.
While most of Asia remains closed for the Lunar New Year, Japanese markets were open for trading, and the Nikkei rallied 1% as export growth came in stronger than expected. The country’s trade minister also announced the first tranche of investments for US infrastructure projects, which was part of the trade deal.
In Europe, we’re also seeing broad-based strength with the STOXX 600 up just under 1%, led higher by Spain and Italy. There’s no real catalyst behind the gains, but UK and French CPI data were generally inline with expectations.
There’s a busy schedule of economic data today, kicking off with Durable Goods (better than expected), Building Permits (better than expected), and Housing Starts (better than expected) at 8:30, followed by Industrial Production and Capacity Utilization at 9:15 followed by Leading Indicators at 10:00. At 2 PM, we’ll also get the Minutes from the January FOMC meeting, and in between Fed Vice Chair Bowman will be speaking in DC at 1 PM Eastern.
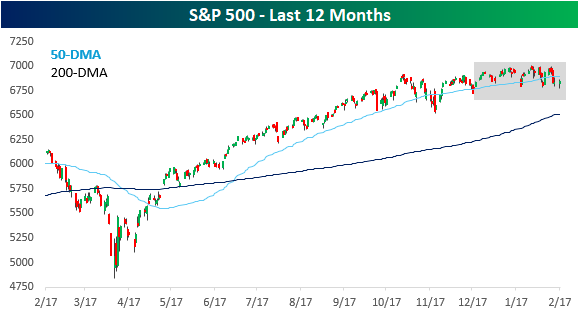
There have been 31 trading days so far in 2026, and for many, it’s been an exhausting year in the markets. For all the sound and fury, though, consider this. On 12/31, the S&P 500 closed at 6845.50. Yesterday, it closed at 6843.22. Just two points lower! For the year, the S&P 500 is down just 0.03%!
On the one hand, the S&P 500’s inability to make any headway this year (and over the last five months, for that matter) is enough to make you want to rip your hair out, but after the rally the market had off the April lows, some consolidation was in order, so you could say this is exactly what the market needed.
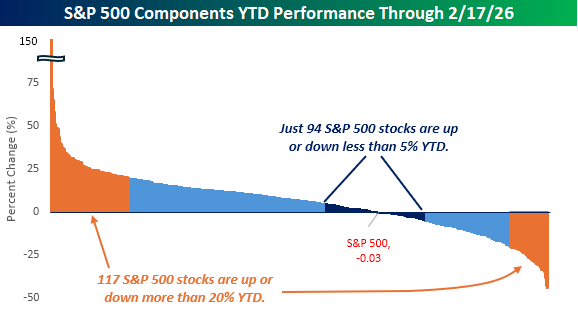
While there’s been nothing going on at the index level, underneath the surface, we’ve seen massive rotation. While the S&P 500 is flat on the year, just 94, or less than 20% of the index’s components, are up or down less than 5%. At the extremes, though, 117 stocks are up or down at least 20% YTD! It seems that Washington isn’t the only place where we’ve seen an increase in concentration at the extremes with nothing to show for it.
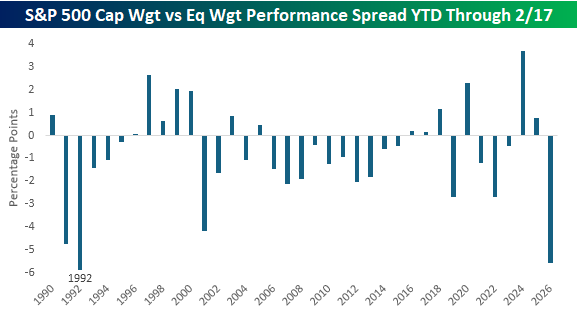
While the big moves in individual components of the S&P 500 haven’t shown up at the index level, on an equal-weighted basis, the S&P 500 has much more to show for it this year as it’s up 5.5% YTD. With that gain, the S&P 500 cap-weighted index is underperforming its equal-weighted peer by 5.53 percentage points YTD. Since 1990, the only other year when the cap-weighted index underperformed the equal-weighted index by a larger amount was in 1992. In that year, the outperformance of the equal-weighted index continued through the rest of the year, but both indices were up more than 5% from that point through year-end.
Feb 17, 2026
This content is for members only
Feb 17, 2026
See what’s driving market performance around the world in today’s Morning Lineup. Bespoke’s Morning Lineup is the best way to start your trading day. Read it now by starting a two-week trial to Bespoke Premium. CLICK HERE to learn more and start your trial.
“I’ve missed more than 9000 shots in my career. I’ve lost almost 300 games. 26 times, I’ve been trusted to take the game-winning shot and missed. I’ve failed over and over and over again in my life. And that is why I succeed.” – Michael Jordan
Below is a snippet of commentary from today’s Morning Lineup. Start a two-week trial to Bespoke Premium to view the full report.
It may be Tuesday morning, but futures are in a Monday mood as the S&P 500 is indicated to open down by 0.40% while the Nasdaq is down double that. The main culprit is the software sector as iShares Expanded Tech Software ETF (IGV) is down 1% in the pre-market, continuing a trend that has been in place for weeks now.
Treasury yields are also lower as the 10-year trades below 4.03%. Will we see a 3-handle this week? While yields are lower, crude oil prices are rallying over 1% to nearly $64 per barrel as President Trump made comments over the weekend that regime change “would be the best thing that could happen” in Iran. Despite the higher oil prices on geo-political concerns, though, gold prices are down 2% and back below $5,000, while silver is down over 4%. Along with lower metals prices, Bitcoin and other crypto assets are also down about 1%.
It was a quiet session in Asia as most markets are closed for the Lunar New Year. Japan was open for trading, though, but with a drop of 0.4% in the Nikkei, maybe it should have stayed closed too!
In Europe, it’s been a more positive tone as the STOXX 600 is up fractionally, led by larger gains in Italy and Spain. Economic sentiment, as measured by ZEW, was significantly weaker than expected, which perhaps makes the odds of rate cuts more likely.
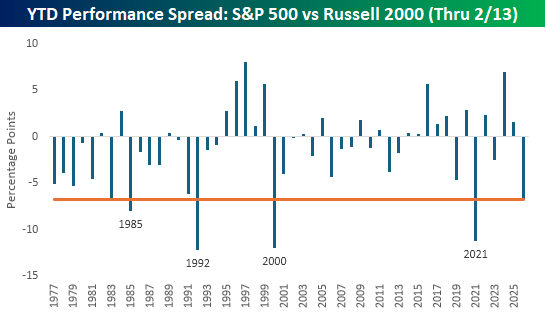
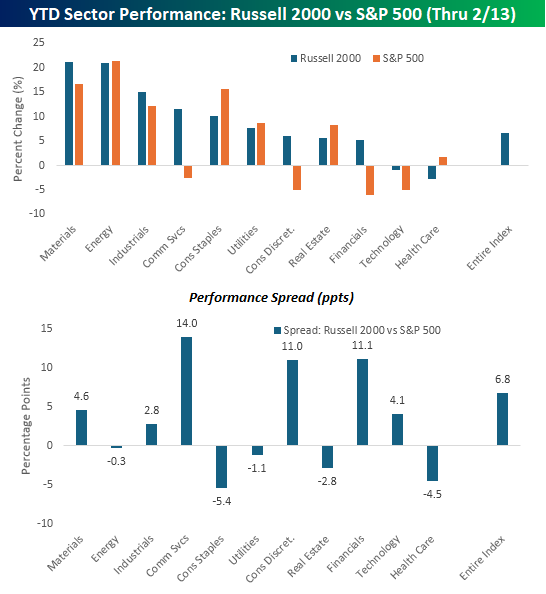
The S&P 500 went into the holiday weekend with a modest decline of 0.14% on a YTD basis, but the small-cap Russell 2000’s performance looks entirely different, as that index has already gained 6.64%. With 6.8 percentage points separating the two indices, small caps are off to their best start relative to large caps since 2021 and the fifth-best start to a year in the index’s history. The only other years besides 2021 when small caps got off to a better start were in 2000, 1992, and 1985.
For most sectors, the performance disparity between small and large-cap stocks has been narrower. The top chart below shows the YTD performance (through 2/13) of each sector in both the Russell 2000 and the S&P 500, and the lower chart shows the performance spread between the two. As shown, the only three sectors where the performance disparity is wider than it is at the index level are in Communication Services, Consumer Discretionary, and Financials, and in all three cases, the disparity is, like it is at the index level, in favor of small caps.
Looking in the other direction, there are actually five sectors where large caps are outperforming their small-cap peers. The widest disparities in favor of large caps are in Consumer Staples and Health Care, but large-cap Real Estate, Utilities, and Energy are also outperforming.
Feb 13, 2026
See what’s driving market performance around the world in today’s Morning Lineup. Bespoke’s Morning Lineup is the best way to start your trading day. Read it now by starting a two-week trial to Bespoke Premium. CLICK HERE to learn more and start your trial.
“Volatility obscures the future but does not necessarily determine the future.” – Peter Bernstein
Below is a snippet of commentary from today’s Morning Lineup. Start a two-week trial to Bespoke Premium to view the full report.
After yesterday’s sharp declines, bulls were in no rush to get back to work this morning ahead of the January CPI report, with futures on the major indices all down about 0.20%. The 10-year yield was basically unchanged at 4.10%, down from 4.23% earlier in the week. Crude oil was also modestly lower, while gold is marginally higher and silver rallies close to 3%. Bitcoin is up a little over 2% but still below $67K.
In Asia, equities were lower across the board with the Nikkei down 1.2%, Hong Kong down 1.7%, and China’s Shanghai Composite falling 1.3%. Despite those losses, Japan still finished the week 5% higher, while South Korea rallied more than 8%!
In Europe, equities were mostly lower but by more modest amounts. The STOXX 600 is down 0.4%, putting it in the red for the week, while Germany bucks the trend with a gain of 0.1%. Q4 GDP for the continent grew 0.3%, which was right in line with expectations.
CPI just hit the tape, and the market liked it! Headline CPI came in weaker than expected, with the y/y reading was 2.4% compared to forecasts for 2.5%. Core CPI was right inline with forecasts at 0.3% m/m. In reaction, futures have bounced into positive territory, while the 10-year yield dropped to 4.07%. Is a 3-handle on the way?
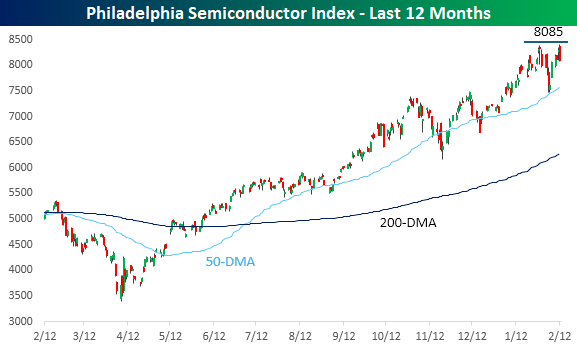
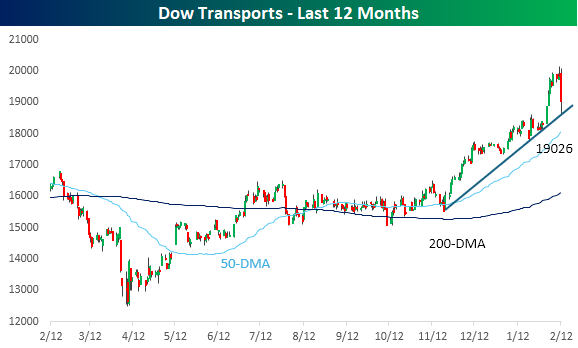
It was a rough day for two very important sectors often considered leading indicators of the physical and digital economy, as the Dow Transports fell 2.5% while the Philadelphia Semiconductor index (SOX) plunged just over 4%. That’s enough to instill some fear in the minds of already nervous investors.
Starting with the Transports, yesterday’s pullback found support right at the index’s uptrend line that has been in place since late last year. Looking at the chart, even bulls have to admit that as painful as yesterday’s sell-off was, the surge in the prior couple of weeks had also gotten ahead of itself.
Moving on to the transports of the digital economy, the SOX has been on a tear for nearly a year now, and even after yesterday’s decline, it has more than doubled off its April lows. Doubled! That being said, yesterday’s decline came right after the index had come up just shy of taking out its prior high from January, so until that resistance is taken out, the burden of proof is on the bulls.