Bespoke’s Morning Lineup – 3/24/26 – Market Wants an Offer Neither Side Can Refuse
See what’s driving market performance around the world in today’s Morning Lineup. Bespoke’s Morning Lineup is the best way to start your trading day. Read it now by starting a two-week trial to Bespoke Premium. CLICK HERE to learn more and start your trial.
“I don’t trust society to protect us, I have no intention of placing my fate in the hands of men whose only qualification is that they managed to con a block of people to vote for them.” – Mario Puzo, The Godfather

Below is a snippet of commentary from today’s Morning Lineup. Start a two-week trial to Bespoke Premium to view the full report.
Paul Hickey will be on Making Money With Charles Payne today on Fox Business between 2 PM and 3 PM to discuss markets and the latest events in Iran. Check it out if you can!
Equity futures have been ping-ponging between gains and losses since the close yesterday, and they’re now on the red side of the table. Futures on the S&P 500 and Nasdaq are both down 0.1%. The 10-year yield has moved back to 4.36%, gaining 3 basis points. Oil prices moved back above $90 as investors try to figure out how things will play out in Iran. Good luck with that! Gold and other precious metals have seen muted moves this morning, with gains or losses of 1%, while Bitcoin has a fractional gain of 0.5%, taking it back above $71K.
It’s a relatively busy day for data this morning with Non-Farm Productivity and Unit Labor Costs at 8:30, but both reports are stale given the war situation. Investors will probably focus more attention on flash PMIs for March from S&P at 9:45 and the Richmond Fed at 10 AM. All of these reports will take a backseat to whatever geopolitical headlines or “truths” hit the tape.
European stocks were still open for trading yesterday when President Trump made his comments regarding Iran. Therefore, they had the opportunity to adjust, but this morning they’re adding modestly to those gains with the STOXX 600 up 0.3%. Flash PMI readings for March were also released. While manufacturing indices were better than expected, service sector PMIs generally missed.
Asian stocks played catch-up and followed the US lead overnight with gains across the board. Japan was up 1.4% while China rallied nearly 2%, and the Kospi gained 2.7%. The gains weren’t steady, though. In South Korea, for example, the KOSPI started the day with a gain of more than 4% but gave back all those gains early in the session and briefly traded lower before rebounding in the second half of the session. Inflation data in the region was on the light side as Japanese CPI and South Korean PPI for February both rose less than expected. While the lower inflation data was welcome, flash PMIs for Australia and India were both lighter than expected.
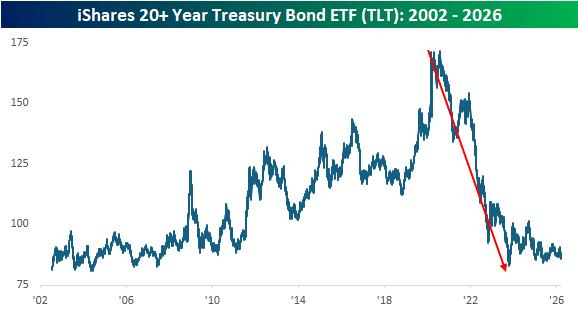
After falling more than 50% in price terms from its closing high in August 2020 to its low in October 2023, long-term US Treasuries, as proxied by the iShares 20+ Year US Treasury ETF (TLT), remain in the back half of a lost decade. As shown in the chart below, while prices remain near their multi-year lows, they have stopped going down, and with the long end of the curve yielding close to 5%, a flat market in price terms isn’t so bad.
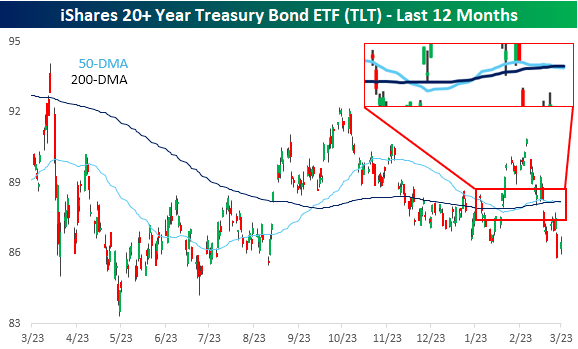
Looking at a one-year chart of TLT shows an interesting pattern. We’ve discussed the nowhere direction of the equity markets and some notable stocks like Nvidia (NVDA) extensively over the last several weeks, but the treasury market has also been comatose. Look at TLT’s 50 and 200-day moving averages (zoomed in on the inlay). Over the last several weeks, the two have moved in lockstep.
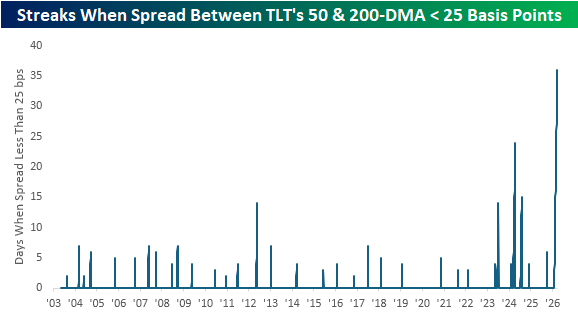
The two moving averages have been moving in such unison that yesterday was the 36th straight trading day the spread between the two was less than 25 basis points. Looking back at the ETF’s history over the last 20+ years, this current streak ranks as the longest in its history. It’s longer than the next closest one by more than two weeks! With the current spread between the two at less than 4 bps, it doesn’t appear likely to widen out to more than 25 bps any time soon!
Bespoke’s Morning Lineup – 3/23/26 – Early Morning Reversal
See what’s driving market performance around the world in today’s Morning Lineup. Bespoke’s Morning Lineup is the best way to start your trading day. Read it now by starting a two-week trial to Bespoke Premium. CLICK HERE to learn more and start your trial.
“Appear weak when you are strong, and strong when you are weak.” – Sun Tzu
Below is a snippet of commentary from today’s Morning Lineup. Start a two-week trial to Bespoke Premium to view the full report.
Asian stocks plunged overnight, Europe was lower, and US futures were in the red about an hour ago, but all it took was one Truth Social Post to erase those losses and push stock futures firmly into the green. The S&P 500 and Nasdaq are both on pace to gap up more than 1.5% at the open, and European stocks are up by about 1%. Treasury yields are modestly lower, but the 10-year yield is still at an uncomfortably high 4.39%. After trading higher earlier, crude oil is down 7% to just under $92 per barrel. Gold is still trading down by close to 4%, sitting at $4,400 per ounce. At the end of January, it was more than $1,000 higher!
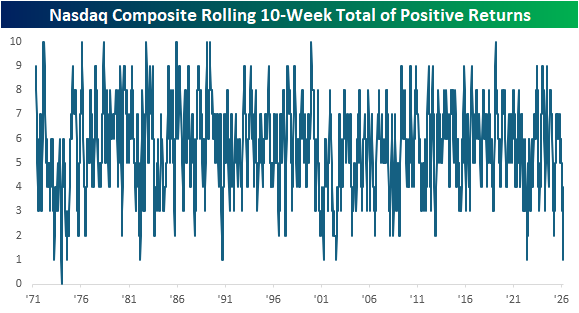
After last week’s declines, the Nasdaq finished lower for the fourth week in a row and the ninth week in the last ten. For ten weeks, that’s the fewest positive weeks since June 2022 and before that, July 2002. In the Nasdaq’s entire history, there have only been eight other periods when the Nasdaq declined for nine or more weeks in ten weeks, and only one of those periods saw the Nasdaq go ten straight weeks with declines.
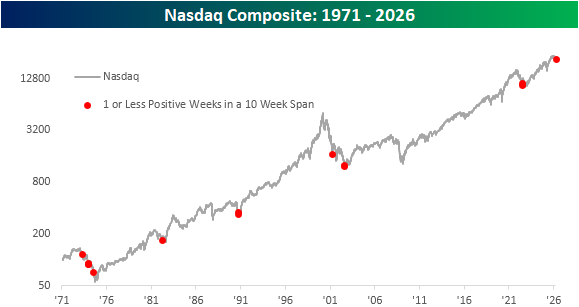
Below, we show when each of these prior periods occurred on a long-term chart of the Nasdaq. Outside of the period in the mid-1970s, these other occurrences all came in the later stages of market declines. That sounds like good news, but a counter to that is that the only other time the Nasdaq declined for nine weeks in a ten-week span and was still so close to 52-week highs was in that early 1970s period.
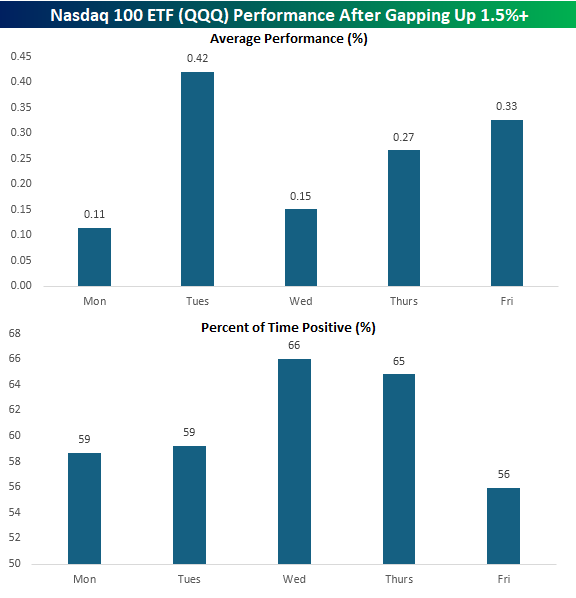
While it was looking like another negative start to the week earlier, futures took a sharply positive turn after the President’s Truth Social post saying that the US and Iran had engaged in conversations “regarding a complete and total resolution” of hostilities. As a result, the Nasdaq 100 ETF (QQQ) is on pace to gap up 1.5% at the open. If those gains hold through the open, it would be the first 1.5%+ upside gap for QQQ this year and the 266th since the ETF’s inception in 1999.
The chart below shows QQQ’s average performance from the open to close after gapping up 1.5%+ at the open based on the day of the week it occurred. Of the 46 that occurred on a Monday, QQQ’s average performance from the open to close was a gain of 0.11% with positive returns 59% of the time. While positive, that ranks as the worst performance from the open to close following a 1.5%+ upside gap of any other weekday.
“Sir, We’re Going to Need a Bigger Rabbit”
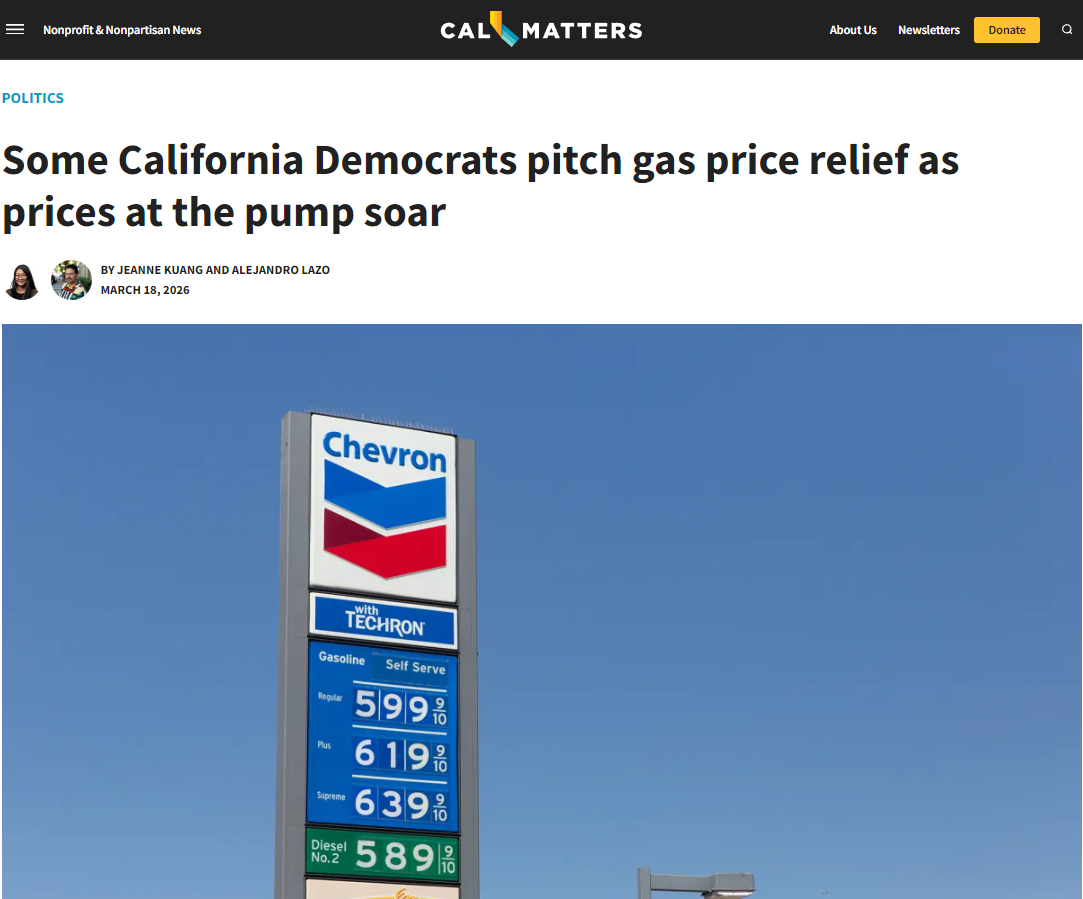
Memorial Day weekend and the beginning of the summer driving season is barely more than two months away. Were you planning a road trip? Well, maybe you’re starting to have second thoughts. Gas prices around the country have surged, and at times like this, the pictures from California always get the most attention. While we’ve seen pictures of even higher prices, the one below pretty much encapsulates what you’ll pay in the high gas price capital of the continental US. With prices reaching $6/gallon for the “cheap stuff”, shelling out $100 each time you go to get gas is now the norm. That’s before snacks, drinks, and the obligatory scratch-offs!
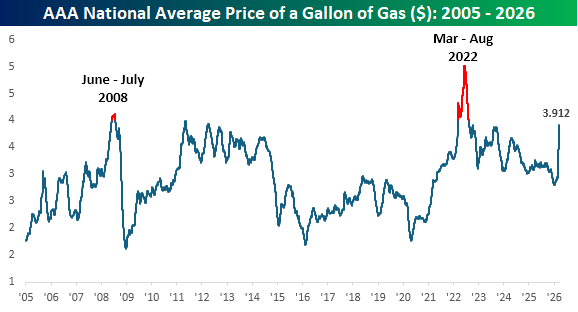
Obviously, California is not the norm. On a national basis, the average price of a gallon of gas, according to AAA, is still at $3.91 and will likely tip above $4 by early next week. Since the start of 2005, only two other periods have seen prices top $4. The first was from June to July of 2008, just as the Financial Crisis was accelerating. Then, in April 2022, after Russia invaded Ukraine, prices shot up to near $5 and stayed above $4 through early August.
The US consumer isn’t nearly as exposed to energy in terms of their total spending as they have been in decades past, but $4 still hurts. In 2008, the US economy experienced one of the deepest recessions in its history, and while the economy didn’t tip into a recession in 2022, GDP did turn negative, and stocks were in a bear market.
Besides filling up the tank, rising energy prices are showing up in other areas, notably airfares. So, if you thought the TSA security lines, which are growing longer by the day due to the shutdown, were a slap in the face, now you get to pay much more for the privilege of flying.
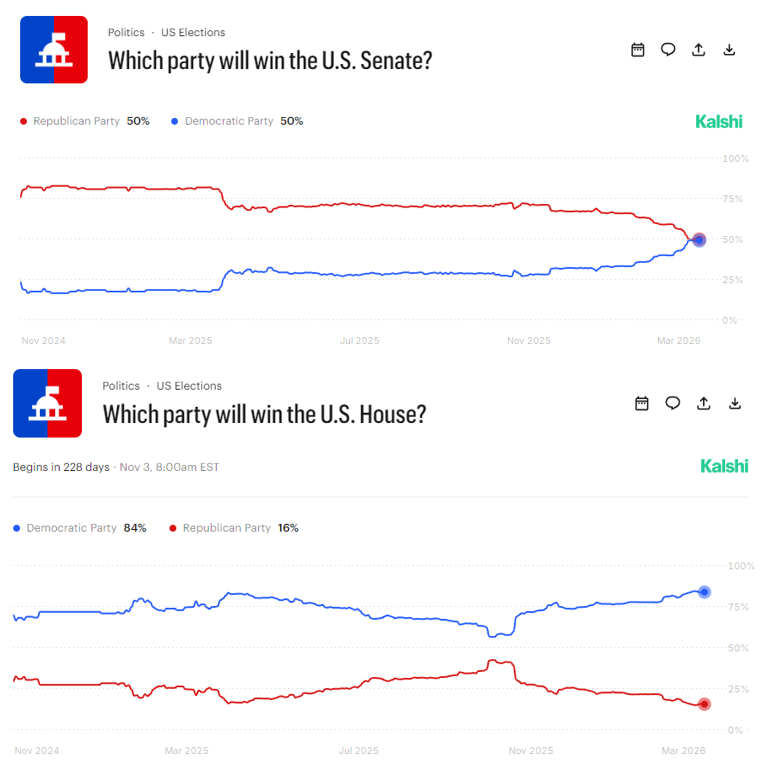
Between rising energy prices and a government shutdown that politicians have little urgency to end, if you’re up for re-election this year, good luck. This year, that spells trouble for Republicans. While it’s been widely assumed that Democrats would regain control of the House for some time now, in recent weeks, prediction markets have seen those odds increase to the highest levels since the last Presidential election (lower chart).
The picture in the Senate (top chart) is more interesting. While Republicans have largely been expected to maintain control after the midterms, in the last several days, prediction markets are now a toss-up for the Senate and moving in the wrong direction for the GOP. Whatever your political leanings, if you think that DC has been dysfunctional in terms of getting things done for the last year, just wait until next year if Democrats take control of both chambers of Congress. President Trump has shown an ability to pull rabbits out of his hat in the past, but as the midterms inch closer and gas prices sprint higher, the longer this trend persists, the bigger the bunny he’s going to need to pull out of his hat.
Like this analysis? Become a Bespoke Premium member today using our March Madness special! Click below for details on how to sign up:

Bespoke’s Morning Lineup – 3/20/26 – Stocks, A Port in the Storm
See what’s driving market performance around the world in today’s Morning Lineup. Bespoke’s Morning Lineup is the best way to start your trading day. Read it now by starting a two-week trial to Bespoke Premium. CLICK HERE to learn more and start your trial.
“The longest way must have its close – the gloomiest night will wear on to a morning.” ― Harriet Beecher Stowe
Below is a snippet of commentary from today’s Morning Lineup. Start a two-week trial to Bespoke Premium to view the full report.
A negative week is on pace to finish with a negative session as the S&P 500 looks to finish lower for the fourth week in a row and the sixth down week in the last seven. S&P 500 and Nasdaq futures are both down about 0.5% but off their overnight lows. Where we close, though, will depend almost entirely on the price of oil, which is down 1% to $95.15 per barrel. Treasury yields are modestly higher, with the 10-year yield just under 4.3%, while gold is up 1.3% and Bitcoin is holding above $70K.
In Asia overnight, most major equity indices in the region were lower, although the KOSPI rallied 0.3% to finish up 5.4% for the week. In Europe, we’re seeing more muted performance to close out the week. The STOXX 600 is down 0.1%, which would put it down more than 2% for the week, but Spain has bucked the negative trend, rallying 1% today and putting it into positive territory for the week.
There’s no economic or major earnings data on the calendar today, so geopolitical headlines will dictate the market’s performance.
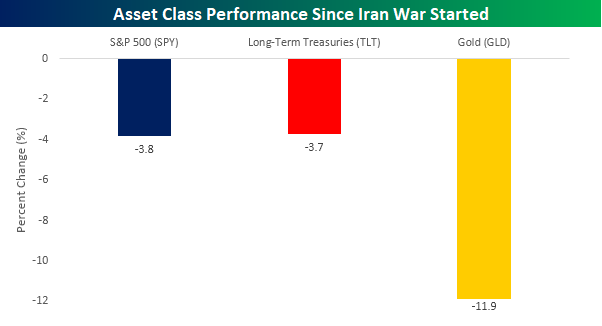
Heading into today’s session, the S&P 500 is down nearly 4% this month, which is unsurprising given the war in the Middle East. It’s only natural in times of geopolitical uncertainty for investors to move out of riskier assets into the safety of treasuries or even gold, the ultimate port in geopolitical storms. So, how are those two asset classes doing this month? Long-term treasuries, as proxied by the iShares 20+ Year Treasury ETF (TLT), are down 3.7%, which is basically in line with the S&P 500, while gold (GLD) is down more than triple either of the other two, with a decline of 11.9%. Just when you think you have it all figured out.
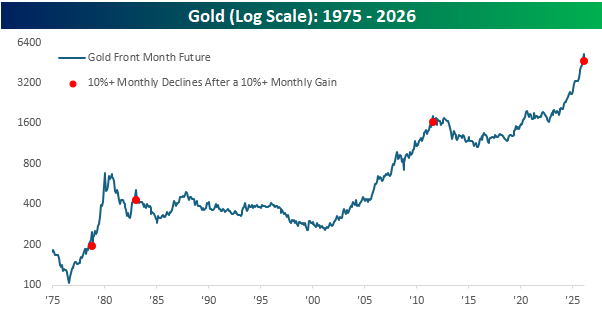
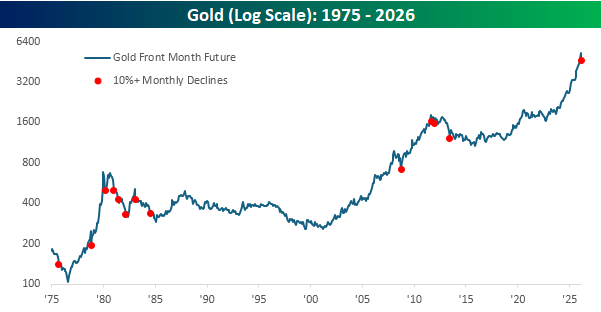
Gold’s double-digit percentage decline this month is on pace for the largest monthly decline in the commodity since June 2013 and, if it holds, would rank as the eighth largest one-month decline in gold since at least 1975. What’s even more interesting is that this month’s decline follows a double-digit percentage gain in February.
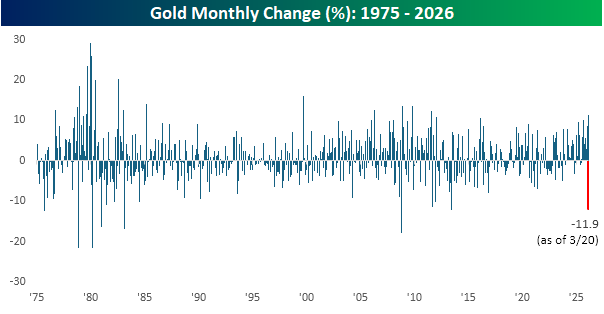
The chart below shows gold’s performance since 1975, and each red dot shows months when it declined 10% or more. Most of these declines occurred either early on or well into longer-term downtrends. There were some exceptions, though. The decline in October 2008 occurred right near the low for that period, and after the decline in November 1978, gold more than tripled over the next year.
Looking at just the periods when gold declined by at least 10% following a double-digit percentage gain. Here, the sample size is much smaller, with just three other occurrences. The two most recent, in 2011 and 1983, were followed by years of weakness, while the one other occurrence in 1978 was the one period where gold quickly tripled.