Sentiment Stays Bearish
Even before the extreme volatility of the past week, the technical correction in stock prices had meant that investor sentiment tanked. Granted, even when the S&P 500 was last at an all-time high in mid-February sentiment leaned bearish with the percentage of respondents to the weekly AAII survey reporting as bulls only sitting at 29.2% as of February 20. Over the next three weeks, it dropped to local lows in the 19% range and as of today’s release, it was back up to 28.5%. In other words, even through all the crazy moves in the market, investors amazingly appear to be only slightly less bullish than they were at the time of the February 19 high.

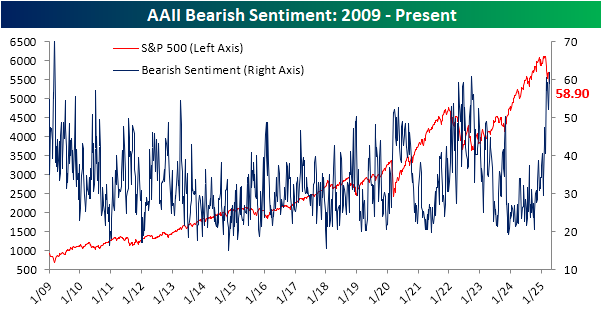
Of course, that is still a muted level of bullish sentiment. Meanwhile, the percentage of respondents reporting as bears is much more elevated than it was two months ago. Whereas the February 20 reading in bears was only 40.5%, today it is at 58.9% which was down versus 61.9% last week.
That means that investors continue to overwhelmingly report bearish sentiment with increased polarization to boot. The share of respondents reporting neutral sentiment reaffirms this. That share dropped to a meager 12.5% in the latest week’s data. That ranks in the first percentile of readings in the full history of the data dating back to 1987 and is the lowest reading since it came in at 11% on May 28, 2009.

Of course, other sentiment surveys offer additional looks at investor sentiment. One such report is the Investors Intelligence survey which has a survey base of newsletter writers. One perk of this survey is a much longer history beginning back in 1963. This week’s release indicated the lowest level of bullish sentiment, 23.6%, since December 2008. Before that, the last time sentiment was this weak was in July 1994. So it’s been rare for investors to be this outright negative of equities.
We would also note that this survey collects data through Tuesday afternoons with a release early Wednesday mornings. That means this latest data would not have reflected any reaction to yesterday’s update on tariffs nor the massive surge in stock prices in response.

That weak sentiment is unsurprising given the trade war’s implications for the global economy and the collapse and general volatility in stock prices we have seen in the past week. To help further quantify this, in the chart below we show the percentage spread between the S&P 500’s closing highs and lows for all one-week periods ending Tuesday, which coincides with the Investors Intelligence survey’s collection period, going back to the start of the survey data in 1963. In the latest week, we saw a 12% range between the S&P 500’s high and low on a closing basis, one of the more volatile weeks of this period.

In the chart below, we show those weeks when the S&P 500 had a 10%+ range between high and low closing prices during the Investors Intelligence survey collection period while also trading lower during the span. As shown, the past week was the 18th example. For starters, the S&P 500’s range this go around was middling (47th percentile) for these occurrences although the decline was one of the larger ones, slightly outpacing the median decline of 9.5%.
As for the changes in sentiment, bullish sentiment according to the Investors Intelligence survey is the second lowest of these instances behind late October 2008. The week-over-week decline was also larger than normal, nearly doubling the average move. While that survey’s bearish sentiment reading wasn’t even in line with the average, the week-over-week uptick was again more than double what has historically been the norm during weeks with this much volatility. In other words, currently, we are seeing extreme volatility and extremely bearish investor sentiment, especially among investment professionals (i.e. newsletter writers).


The Closer – Tariff Chaos, Momentum Shift, Fed – 4/9/25
Log-in here if you’re a member with access to the Closer.
Looking for deeper insight into markets? In tonight’s Closer sent to Bespoke Institutional clients, after a wild session, we start by reviewing the latest tariff news (page 1) in addition to the reaction across assets (page 2 and 3). Focusing in on equities, we also show just how strong breadth was (page 4) and the incredible turnaround in momentum (page 5). After a review of the latest Fed developments (page 6), we finish by reviewing today’s very strong 10-year note reopening (page 7).

See today’s full post-market Closer and everything else Bespoke publishes by starting a 14-day trial to Bespoke Institutional today!
Chart of the Day: Historic Session But Still a Bad Start to the Administration
This content is for members onlyThe Closer – Bond Selloff, SPY Sputters, Yuan Down – 4/8/25
Log-in here if you’re a member with access to the Closer.
Looking for deeper insight into markets? In tonight’s Closer sent to Bespoke Institutional clients, we begin with a note on the sell off in bonds and commodities (page 1) and then a look at the intraday reversal in equities (pages 2 and 3). We then dive into the selloff in the Chinese Yuan (page 4 and 5).

See today’s full post-market Closer and everything else Bespoke publishes by starting a 14-day trial to Bespoke Institutional today!