Jun 23, 2025
Log-in here if you’re a member with access to the Closer.
Looking for deeper insight into markets? In tonight’s Closer sent to Bespoke Institutional clients, we start out with commentary on what the market’s verdict is for the Iran situation (page 1). We then review the latest housing data (page 2) including a look at affordability (page 3). We then finish with a rundown into crude oil’s volatile session (page 4).

See today’s full post-market Closer and everything else Bespoke publishes by starting a 14-day trial to Bespoke Institutional today!
Jun 23, 2025
Alphabet’s (GOOGL) Waymo now has competition as Tesla (TSLA) rolled out its robotaxi software this weekend. The EV giant’s autonomous taxis took their inaugural rides in Austin, Texas for a limited number of invite-only customers. Given that limited initial release, it’s fair to say that the robotaxi still has some time left until they are a common site like Ubers (UBER), Lyfts (LYFT), and Waymos in select cities, but nonetheless, robotaxis are now on the road. In response to this news, shares of Tesla (TSLA) are surging. At intraday highs, the stock was up 10%+, and although it has pulled back since then, it is still up an impressive 9.4% as of this writing. That ranks in the 98th percentile of daily gains since the stock first hit the public market 15 years ago this month.

As shown in the chart above, while the move today is large, there’s actually been plenty of precedent for as large, if not larger, moves in the past several months. In fact, today’s move is only the largest gain since April 25th when it was up 9.8%, and it was up an even larger 22.7% on April 9 after the announcement of the reciprocal tariff suspension by President Trump. Putting all this context together, in the chart below we show TSLA’s average daily change (in absolute terms) on a rolling six-month basis. As shown, the only time daily volatility has been higher for TSLA was during the early days of COVID.

Along with high daily volatility, Tesla (TSLA) has had a roller-coaster ride over the last year with four 20%+ rallies and four 20%+ declines. After rallying 150% in the back half of 2024, TSLA fell more than 50% earlier this year. The stock most recently fell 21% over a 9-day stretch from May 27th through June 5th when Elon Musk was fighting with President Trump online. Since the 5th, things have settled down, and the stock has quickly bounced back by 23%.

To get a read on how common it is for Tesla (TSLA) to see this sort of volatility, in the charts below we show the number of TSLA 20%+ rallies and declines by year since its IPO 15 years ago. Since its IPO, TSLA has averaged 4.25 bull/bear market cycles per year. It has already seen five in 2025.
In the second chart below, we show the number of these rallies and declines per year only through the month of June. Again, 2025 has already seen 5 of these rallies and declines, which surpasses the four seen in 2021 and 2022 for a new record.


Jun 18, 2025
Log-in here if you’re a member with access to the Closer.
Looking for deeper insight into markets? In tonight’s Closer sent to Bespoke Institutional clients, we lead off with a recap of the FOMC and the more important Summary of Economic Projections (page 1). We also check in on the release of the TICS data (page 2). Next, we review the latest residential construction figures (page 3) including a look at affordability (page 4). We finish with an update on the latest crude inventory readings (page 5).

See today’s full post-market Closer and everything else Bespoke publishes by starting a 14-day trial to Bespoke Institutional today!
Jun 18, 2025
Yesterday, the NAHB published its latest monthly update on homebuilder sentiment. The headline sentiment index continued to deteriorate falling 2 points to 32, the lowest reading since December 2022.

In the table below, we show each component of the index in addition to its month-over-month change and how they rank as a percentile of their full histories. Indices declined for both present and future sales, resulting in each one now sitting in the bottom quartile of historical readings. The largest declines were observed in the regional data as the Northeast experienced a bottom decile monthly decline and the South experienced a bottom 1% decline.

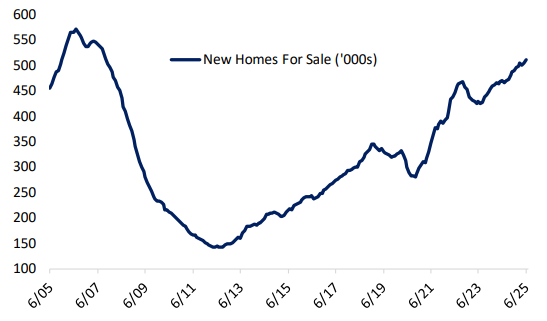
These latest dips in sentiment come as inventories continue to rise, especially in the South and West. Homebuilder sentiment in both of these regions fell to their lowest levels since 2012 this month, and as shown below, these are the two regions where active listings (homes for sale) have spiked the most.