Aug 18, 2025
Log-in here if you’re a member with access to the Closer.
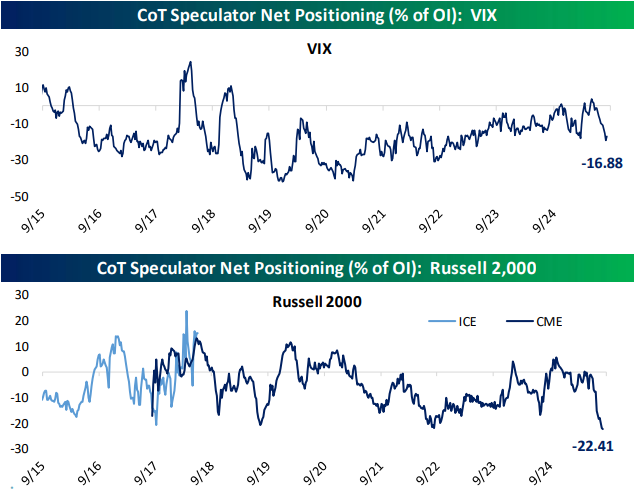
Looking for deeper insight into markets? In tonight’s Closer sent to Bespoke Institutional clients, we start with a look into credit spreads (pages 1 and 2) and how rates volatility has shaped up (page 3). We finish with an update on positioning (page 4).
See today’s full post-market Closer and everything else Bespoke publishes by starting a 14-day trial to Bespoke Institutional today!
Aug 18, 2025
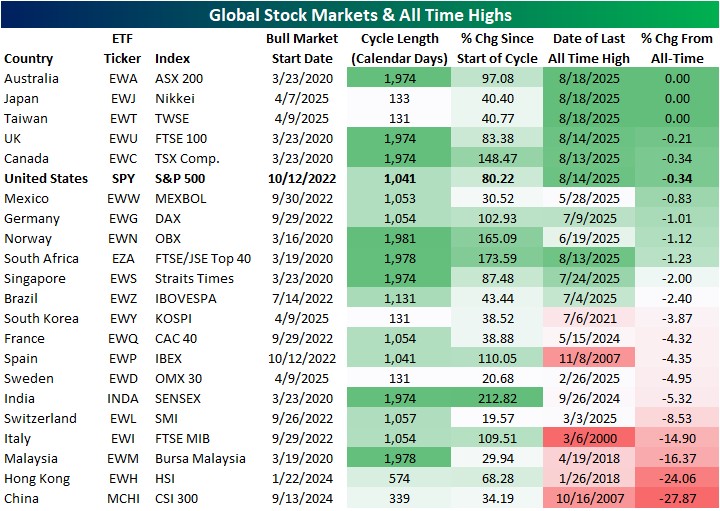
The S&P 500 has seen a slight dip off of record highs in the past few days with many other equity markets around the globe seeing similar price action. As shown below, of 22 major global markets we track, there are currently seven that are within 1% of record highs (priced in local currencies). That includes the S&P 500 which is 0.34% away and three countries trading at record highs as of mid-day Monday: Australia, Japan, and Taiwan. Of those, Japan and Taiwan are actually some of the fresher bull markets (all 22 of these countries are currently in bull markets) whereas Australia is still in the same bull market that has been in place since the COVID Crash lows. The four others within 1% of a high include the UK, Canada, United States, and Mexico. Mexico is the only country within 1% of a fresh high that has yet to have a record close in August. As for the other countries that are further below prior highs, Italy, Malaysia, Hong Kong, and China are the only ones that are still more than 10% away.
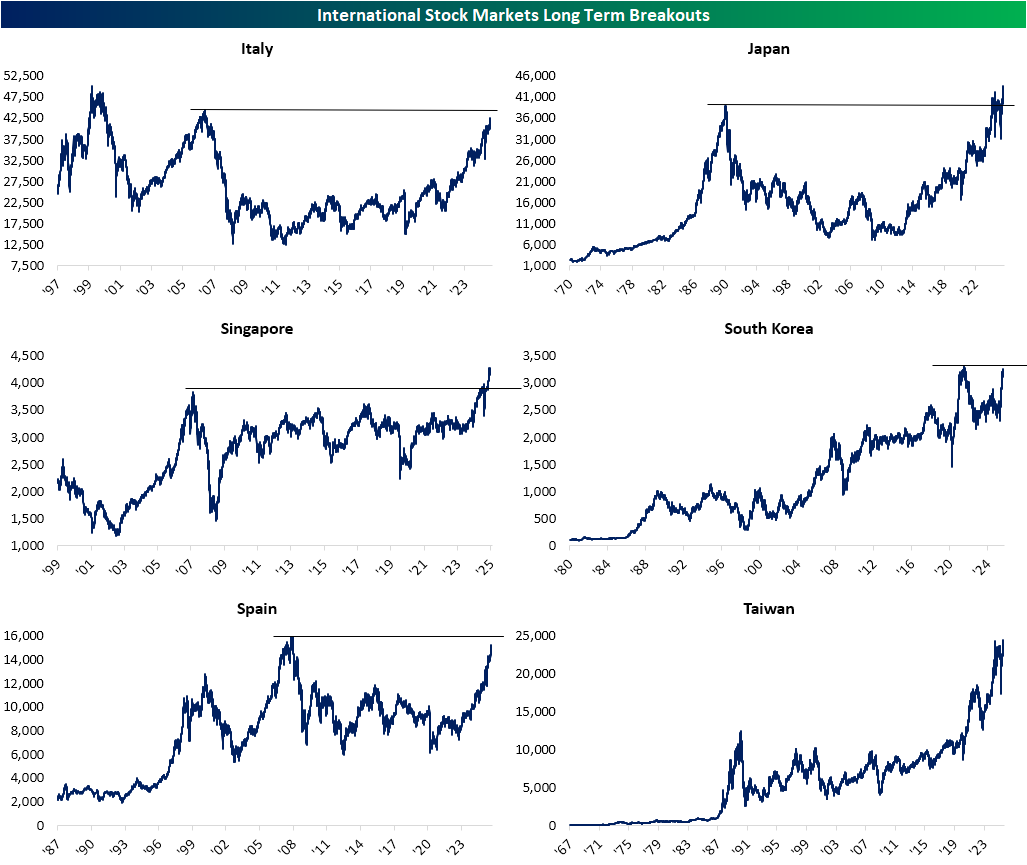
As discussed above, Japan is one of three countries trading at fresh all time highs. While notable on its own, Japan’s rally is even more impressive when put in the context of the past several decades. After peaking on December 29, 1989, Japan didn’t move into the black from those levels until February of last year. While the past 18 months since that initial breakout have seen some fluctuations around those prior highs, this latest rally more clearly defines the breakout. Elsewhere in the APAC region, Taiwan is also at a fresh highs after recently breaking out above more short term resistance of its highs from July 2024. Those are not the only two long term breakouts though. In the first week of this year, Singapore finally reclaimed its peak from October 2007. Outside of the spring dip as trade became front and center, Singaporean equities have left those prior highs in the dust.
While those breakouts have been confirmed, a few other areas are setting up to breakout. Italy and Spain have rallied solidly so far into the 2020s, and as a result of those gains are pressing up towards highs not seen since 2007. For Italian equities, a breakout above those levels would still leave resistance at its early 2000 all time high in play whereas a Spanish breakout would result in all time highs. Over in South Korea, a post-pandemic stock surge sent the KOSPI up to records in the first half of 2021. However, it has now been a few years below those highs. That is until this year. The KOSPI has rallied over 30% since this April’s lows and now it is within 4% of that 2021 peak.
Aug 14, 2025
Log-in here if you’re a member with access to the Closer.
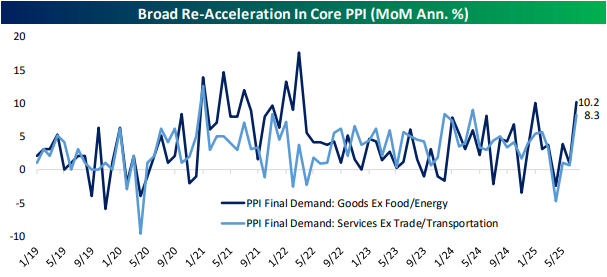
Looking for deeper insight into markets? In tonight’s Closer sent to Bespoke Institutional clients, wekick off with a look into the latest PPI report (pages 1 and 2) followed by an update on our Best of Breed basket (pages 3 and 4). We finish with a look into the disconnect between the Dow Transports and the semis (page 5) and then close out with a look at the latest freight data from Cass (page 6).
See today’s full post-market Closer and everything else Bespoke publishes by starting a 14-day trial to Bespoke Institutional today!
Aug 14, 2025
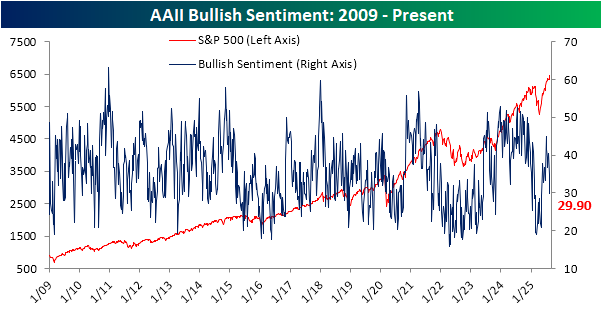
The S&P 500 has had a couple of closes at record highs since last week’s update on sentiment from the American Association of Individual Investors (AAII). However, looking at the latest update, you wouldn’t have guessed the market was doing well. Bullish sentiment shed five points week over week, down to 29.9%, a level not seen since early May.
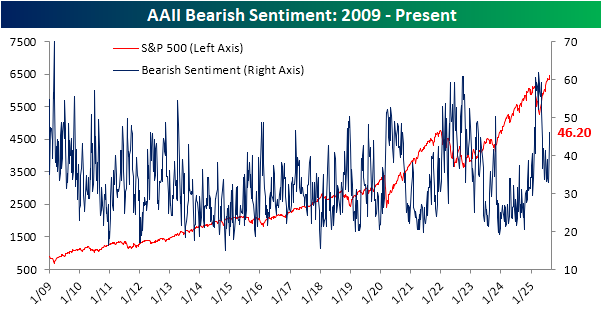
The lack of bulls coincides with a spike in bears up to 46.2%, which is the most elevated since May 8th.
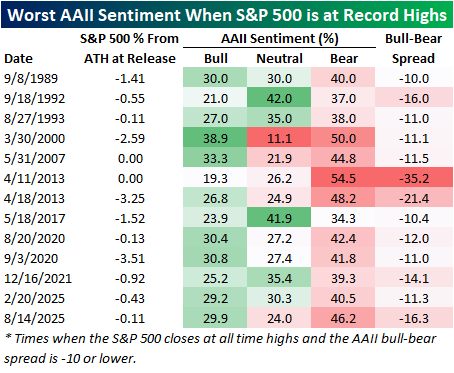
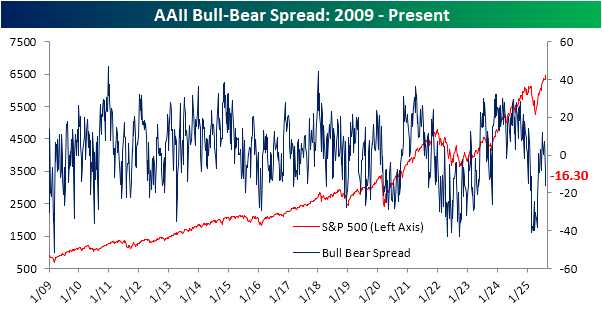
Put together, bears are now outnumbering bulls by 16.3 percentage points, which is the lowest spread since the spring. Additionally, holding aside the fact that the S&P 500 is near record highs, this week’s reading is significantly lower than normal. Historically, the average bull-bear spread has been +6.4, putting the current spread 1.25 standard deviations below the historical average. In other words, sentiment has tipped into what can be considered elevated bearish levels.
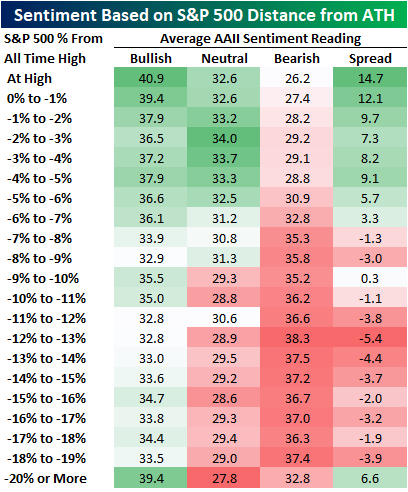
Again, it is one thing for bears to be out in full force to an extreme degree when stocks are weak. It is another entirely more surprising thing to see these levels when stocks are hitting record highs. In the table below, we show the average readings for bulls and bears in the AAII survey based on how far the S&P 500 is trading from all-time highs. As might be expected, sentiment has historically tended to be the most bullish/least bearish when the S&P 500 is closer to all-time highs. However, sentiment also tends to be more bullish when stocks are in pronounced pullbacks of at least least 20%. Comparing that to now, current levels of bullishness are about 11 points lower than what might be expected, and the level of bears is 20 points higher than what might be expected.
The degree to which investors reported as bearish was historic this week. In the history of the weekly AAII investor sentiment survey dating back to 1987, the bull-bear spread has only been lower in a week where the S&P 500 made an all-time high two other times. Both of those instances were in back-to-back weeks in 2013. Other than that, there have only been 13 weeks (including those two in 2013 and now) when the S&P 500 hit record highs and the bull-bear spread was -10 or lower. Before this week, there was also an occurrence earlier this year, almost exactly six months ago, right before the Q1 peak.