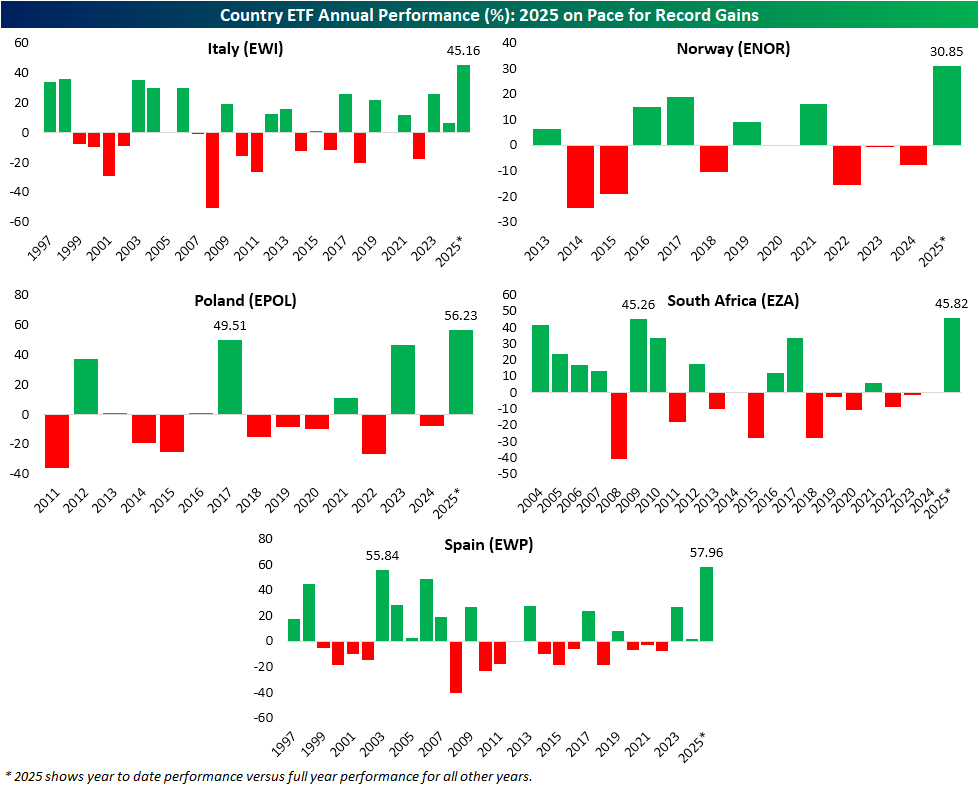
Aug 14, 2025
The S&P 500 has had a couple of closes at record highs since last week’s update on sentiment from the American Association of Individual Investors (AAII). However, looking at the latest update, you wouldn’t have guessed the market was doing well. Bullish sentiment shed five points week over week, down to 29.9%, a level not seen since early May.

The lack of bulls coincides with a spike in bears up to 46.2%, which is the most elevated since May 8th.

Put together, bears are now outnumbering bulls by 16.3 percentage points, which is the lowest spread since the spring. Additionally, holding aside the fact that the S&P 500 is near record highs, this week’s reading is significantly lower than normal. Historically, the average bull-bear spread has been +6.4, putting the current spread 1.25 standard deviations below the historical average. In other words, sentiment has tipped into what can be considered elevated bearish levels.

Again, it is one thing for bears to be out in full force to an extreme degree when stocks are weak. It is another entirely more surprising thing to see these levels when stocks are hitting record highs. In the table below, we show the average readings for bulls and bears in the AAII survey based on how far the S&P 500 is trading from all-time highs. As might be expected, sentiment has historically tended to be the most bullish/least bearish when the S&P 500 is closer to all-time highs. However, sentiment also tends to be more bullish when stocks are in pronounced pullbacks of at least least 20%. Comparing that to now, current levels of bullishness are about 11 points lower than what might be expected, and the level of bears is 20 points higher than what might be expected.

The degree to which investors reported as bearish was historic this week. In the history of the weekly AAII investor sentiment survey dating back to 1987, the bull-bear spread has only been lower in a week where the S&P 500 made an all-time high two other times. Both of those instances were in back-to-back weeks in 2013. Other than that, there have only been 13 weeks (including those two in 2013 and now) when the S&P 500 hit record highs and the bull-bear spread was -10 or lower. Before this week, there was also an occurrence earlier this year, almost exactly six months ago, right before the Q1 peak.


Aug 13, 2025
Log-in here if you’re a member with access to the Closer.
Looking for deeper insight into markets? In tonight’s Closer sent to Bespoke Institutional clients, after a busy day of Fedspeak, we parse recent commentary to see what the likely outcome will be at the September meeting (page 1). We then dive into the bifurcation between well-off and insecure consumers (pages 2 and 3). Next, we check in on the wild moves observed under the hood today including the huge difference between value and momentum (pages 4 and 5). We finish with an update on the rally in crypto prices (page 6).

See today’s full post-market Closer and everything else Bespoke publishes by starting a 14-day trial to Bespoke Institutional today!
Aug 12, 2025
Log-in here if you’re a member with access to the Closer.
Looking for deeper insight into markets? In tonight’s Closer sent to Bespoke Institutional clients, we begin with a rundown of the CPI data (page 1) followed by some commentary regarding the inflation risk premium (page 2). Afterward, we turn over to commentary regarding the President’s choice of who will lead the BLS (page 3). We then dive into earnings results for restaurant brands (page 4) and next up is a review of breadth as the market hits new highs (page 5). We finish with a dive into the Health Care sector’s weakness with focus on GLP-1s and stocks affected by MAHA (pages 6 – 8).

See today’s full post-market Closer and everything else Bespoke publishes by starting a 14-day trial to Bespoke Institutional today!
Aug 12, 2025
This morning’s release of the NFIB’s Small Business Optimism Index saw a return in positivity. After peaking post-election at 105.1 in December, the headline index went on to fall to a low of 95.8 in April and has since erased about half of that decline. At 100.3 in July, it is back above the historical median and at the highest level since February.

As shown in the table below, breadth throughout the sub-indices of this month’s report was solid, with five inputs to the optimism index rising versus two falling and the remaining two going unchanged month over month. Categories that were not inputs to that headline number saw weaker breadth. Of those, five of the eight were lower month over month, including a couple of bottom decile declines from categories like higher prices and compensation.

Of the rising categories, two of the most notable were for expectations for the economy to improve and evaluating now as a good time to expand. For the former, the index surged 14 points month over month to 36. While that is only the highest reading since February and the largest one-month gain since December, the monthly gain ranks in the 95th percentile of all monthly moves on record. Similarly, the 5-point jump in seeing now as a good time to expand also ranks highly in the 95th percentile of monthly changes for that index.

Those two indices appear to be correlated. In other words, when small businesses see the economy as healthier, they will, in turn, see it as a good time to expand. This comes up when looking at the given reasons for different expansion outlooks. For both positive and negative outlooks, economic conditions were the leading reason given as each one was at or tied with multi-year highs and lows. Additionally, as we often note, the NFIB survey has the downside of being politically sensitive. Typically, a Republican administration translates into stronger sentiment and vice versa. With regards to positive expansion outlooks, the political climate is the second most popular reason, and current levels—even though they are off recent highs—are around some of the most elevated readings since the first half of the first Trump administration.

As for indices that declined, one of the bigger drops was for higher prices. While it may not jump out in looking at the chart of the index, that five-point decline ranks as a 5th percentile monthly move for its history, and current levels remain in the middle of the past couple of years’ range since the peak inflation readings in 2021-2023. The reading that points to more substantial progress is with regard to the percentage of firms reporting inflation as their biggest problem. That reading is down to 11%, unchanged month over month, following a number of steep drops in the past year.

Looking across other most commonly reported problems, an equal share of respondents highlighted poor sales. That is the highest reading since February 2021, when that reading was declining off of pandemic highs. While that may sound concerning, we would note it is not far off the average reading (10.5%) observed in the five years from 2014 through 2019.

