The Closer – Shutdown, Memory DRAMa, PMIs – 10/1/25
Log-in here if you’re a member with access to the Closer.
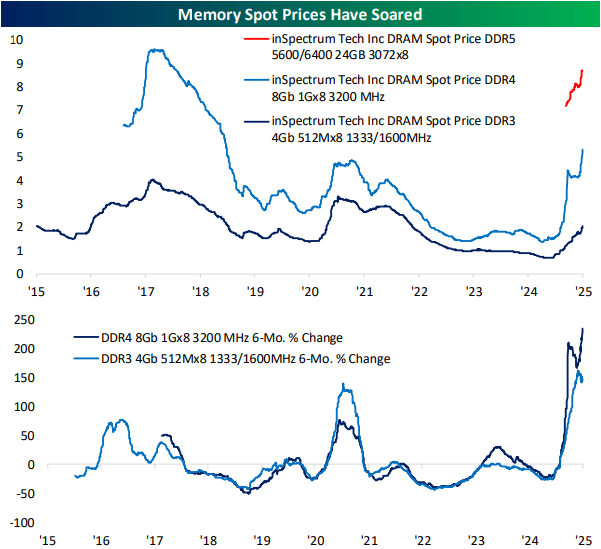
Looking for deeper insight into markets? In tonight’s Closer sent to Bespoke Institutional clients, we start out with a dive into ADP’s employment figures and a note on alternative data given the government shutdown’s effects on data releases (page 1). Next, we update the latest PMI data (page 2). Turning over to stocks, we provide some updates on performance of various baskets (page 3) in addition to a look at the surge in memory prices and related stocks (page 4). We finish tonight’s report with a look at rates (page 5).
See today’s full post-market Closer and everything else Bespoke publishes by starting a 14-day trial to Bespoke Institutional today!
Bespoke Market Calendar — October 2025
Please click the image below to view our October 2025 market calendar. This calendar includes the S&P 500’s historical average percentage change and average intraday chart pattern for each trading day during the upcoming month. It also includes market holidays and options expiration dates plus the dates of key economic indicator releases.
Note: Due to the government shutdown, scheduled release dates are subject to change. Click here to view Bespoke’s premium membership options.
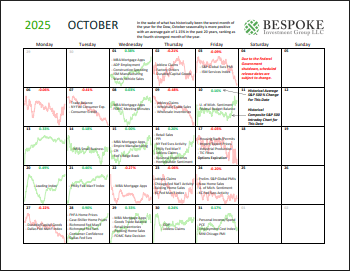
Chart of the Day – September Gains…Thank You Mega-Caps
This content is for members onlyThe Closer – Chinese ADRs & EM, Jobs, BIS Triennial – 9/30/25
Log-in here if you’re a member with access to the Closer.
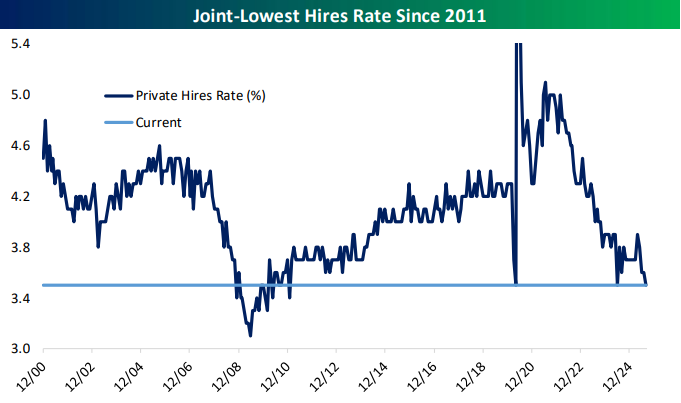
Looking for deeper insight into markets? In tonight’s Closer sent to Bespoke Institutional clients, we lead off with a look at the performance of Chinese ADRs (pages 1 and 2) in addition to the outperformance of EM equities in Q3 (page 3). Next, we dive into the latest jobs data in the form of the JOLTS report (page 4) and Indeed job postings (pages 5 and 6). After that, we review consumer confidence figures (page 7) before closing out with the triennial snapshot of FX and interest rate derivatives (pages 8 and 9).
See today’s full post-market Closer and everything else Bespoke publishes by starting a 14-day trial to Bespoke Institutional today!